Lecture Notes for CS 404/504 Program Monitoring and Visualization
Note to Dr. J: next time you teach this course, review and re-order
some papers and lecture material up to the front.
What this Course is About
This course is a blend of
- dynamic analysis --
the study of program execution behavior, with
- visualization --
the graphical depiction of large amounts of information.
It turns out that much of the key connecting glue between monitoring and
visualization comes from static analysis, the study of
program properties observable from the source code.
Each week, you can expect part of the lecture material to come
from dynamic analysis and part from graphics/visualization.
Similarly, part of the time each week will be studying interesting
work done by others, and part of the time will be engaged playing
with my research infrastructure, working on software tools
that will (hopefully) advance the state of the art.
Reading Assignment #1
- Go read unicon.org. Download the main
Unicon book. Read chapter 1. By Friday, e-mail the instructor with
questions you have about Unicon based on the website and chapter 1.
- Read Program Visualization in a Virtual Environment, by Hirose/Ogi/Riesterer.
By Monday, be prepared to discuss this paper.
Early History of Monitoring and Visualization according to Jeffery
Others may have more and better information, but this is my version of
that subset of computing history relevant to this course.
- In the beginning, there were programs.
- And programs begat bugs. In the
punchcard era, the highlight of one's afternoon often was getting back one's
output from one's daily program run, a short stack of punched cards to the
effect that the program was not executed at all, due to an error in the
source code.
- Eventually programs started to compile or assemble.
- When
a program ran and did not produce expected output, one was supposed to go
back to the source code and read/study/stare at it to find out why. This
still works, some of the time.
When the computing industry reached a stage of having interactive, text
screen terminals, all kinds of new bugs became common-place. Along with
mankind's increased ability to generate bugs, a whole slew of tools and
techniques were developed to understand program executions, including
tracing, and source level debuggers. These tools still work, they just
don't scale well. Sadly, if you look at a modern IDE its debugging and
tracing capabilities are not much improved from what was available 40
years ago. This is (I claim) because problems in monitoring and debugging
are hard, and the cost of building new tools which might advance the
state of the art is very high.
By the 1980's, interactive 2D graphics was ubiquitous and improving rapidly
in performance. People started to use graphics to help understand program
execution behavior partly because text-only techniques did not scale well,
and partly juse because the graphics was available. A movie called
"Sorting out Sorting"
(parts 1,2,3),
originally presented at SIGGRAPH, made a compelling argument that
graphical techniques could be valuable in teaching and understanding
algorithms.
Sorting Out Sorting was done one frame at a time on truly ancient facilities.
A group at Brown University (home of graphics guru Andy Van Dam, algorithms
guru Robert Sedgewick and a cast of thousands) set out to replicate on
interactive workstations what Ron Baecker had done a frame at a time. One
result of this effort was Marc Brown's Ph.D. and related software. We will
present more history in a later session.
What About Us?
- This course is a follow-on to the work presented in my Ph.D.
(insert story of Dr. J's Ph.D. here).
-
The central premise of my Ph.D. is that if we build the
infrastructure needed to reduce program monitoring and visualization to
"no harder than writing ordinary applications" and then use a rapid prototyping
language suitable for research experimentation, we should be able to propel
the state of the art forward.
- My Ph.D. produced an execution monitoring
framework and a 2D graphics API well-suited to these goals. Since then the
monitoring framework has been improved and 3D graphics has become ubiquitous.
- This semester we will find out what we can do with this framework.
Each time I have taught this class, we have propelled the research
forward a little bit.
Announcements
There is a bblearn for this course now. It has a HW#1 posted, but I am not
so sure I like it. I may think of a better HW#1 for you, by this weekend.
Check for HW#1 on Monday. In the meantime, learn some Unicon.
Unicon 101
- Unicon is found at unicon.org
- We will teach Unicon from scratch in this class
- Unicon programs' source code are in .icn files and are compiled
into VM bytecode by default (execution model vaguely resembles Java)
- Unicon programs are organized similar to C++, as a set of functions
and optionally, classes, starting from main().
- For this class, we will have to make sure that you have access to a
machine with unicon, including its (2D and 3D) graphics facilities.
- Unicon comes with a simple IDE; feel free use it or skip it. I use
Emacs but the IDE has a nice help menu that will quicklaunch most
reference documentation. IDE has a known bug on MacOS.
- Unicon itself has one pending 3D bug I intend to fix for this class,
and we may encounter other bugs. In response to those, I will almost
surely (re)build Unicon from sources one or more times during the
semester. You can plan to re-install one or more times. It is research
software. If you were to build Unicon yourself after I announced a bugfix,
this generally requires a complete C/C++ compiler, with supporting tools
such as "make" and "subversion". On Windows we use MSYS and Mingw64.
Unicon: the Easiest Parts
Let's ssh into a test machine to live-demo the following:
| Types | Control Flow
|
|---|
| string | success vs. failure
|
| integer | if-then-else
|
| real | while-do
|
| cset | calls, argument rules
|
| list | generators
|
| table | case-of
|
| file | every-do
|
Alternate Resources for Unicon Study
None of this is assigned reading. It is here for your convenience;
you know, in case you just hate the Unicon book.
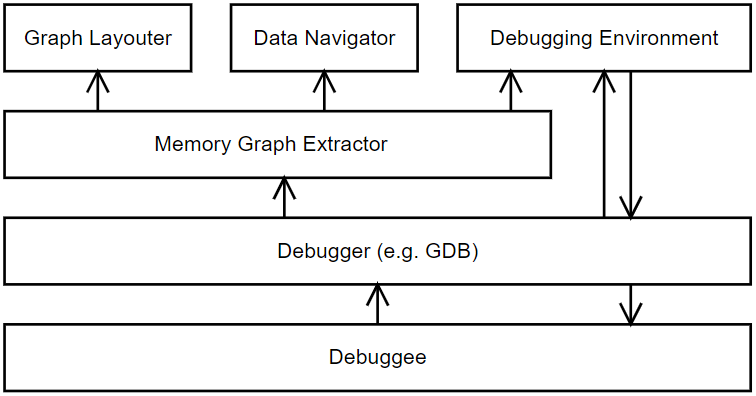
Monitoring Framework Intro
An execution monitor (EM) observes events in a target program (TP).
There are two-process, one-process (callback), and thread-models.
- two-process model
- EM and TP communicate via network sockets, pipes, or files.
- one-process/callback
- The TP calls the EM when an event occurs. The EM is
organized as a set of callbacks, i.e. it doesn't have
its own main() or control flow, it just responds to things.
- thread
- EM and TP are threads in the same address space, making
communication far easier.
Which model do most debuggers use? The two-process model. Which model should
we use for visualization tools? What is different about their requirements?
- two-process model
- Pros:
- easiest to do language-neutral and cross-language.
- Least intrusive
Cons:
- slowest option; fast enough for debuggers but not for visualization
- low-level and/or difficult access to TP state
- one-process/callback
- Pros:
Cons:
- intrusive (monitor shares target program stack and globals)
- most difficult for monitor programming (no control flow!)
- thread
- Pros:
Cons:
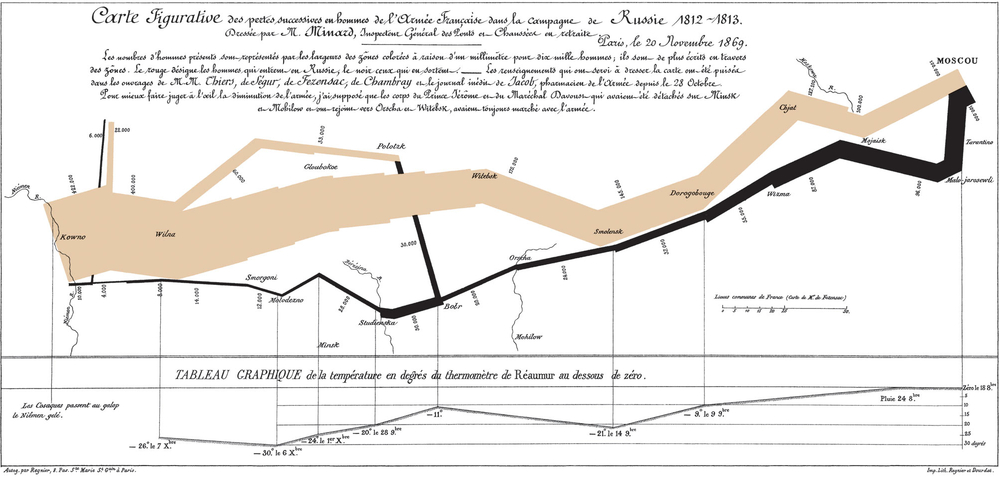
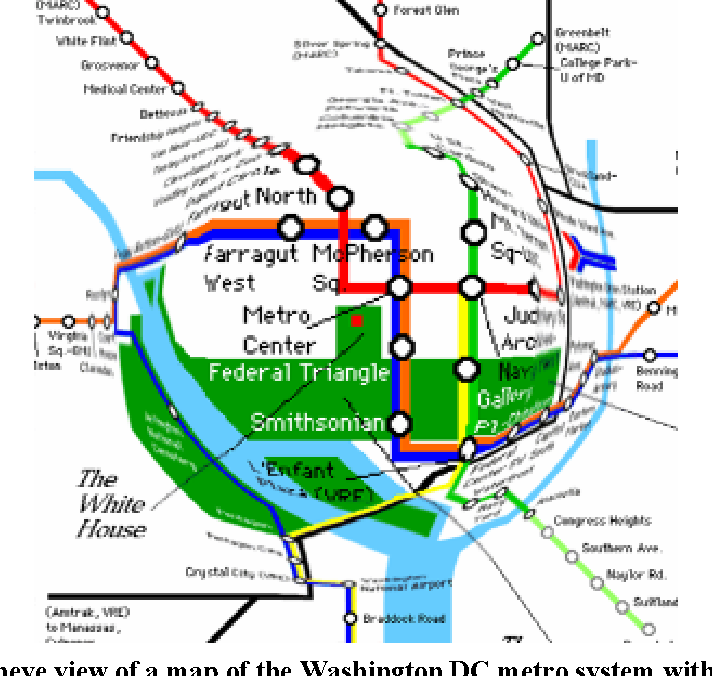
Graphic Design of the Day: a map
Napoleon's March into Russia: proof you can
legibly plot extra dimensions atop a map.
Maps have legends to explain what's on them,
along with two primary dimensions which are
intuitively based on actual geometry.
lecture 3
Reading for this week
Compared with last time I taught this class, I want you to spend enough time
to learn Unicon, or rather the 1/2 of it that will be useful
for writing visualization tools.
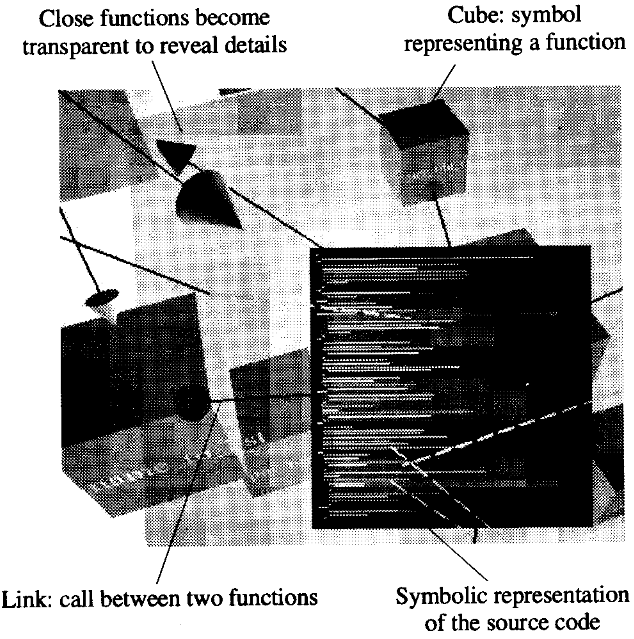
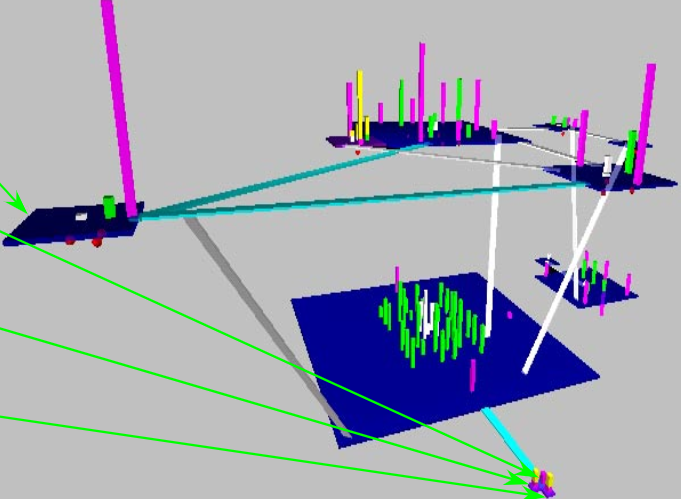
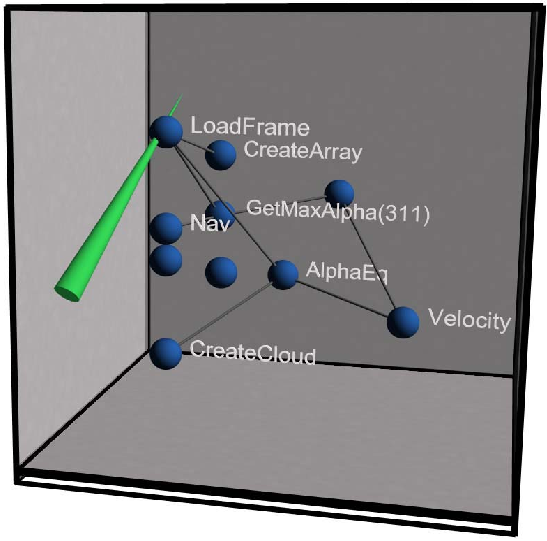
Highlights from Hirose
[Hirose97] describes research from the University of Tokyo, presented
at the annual conference of the World Society for Computer Graphics.
- What do Hirose et al mean by "virtual environment"? What does a
virtual environment have to do with program visualization?
- Goal of visualization: help human build a cognitive model
of a large, complex software system.
- when are graphic representations more useful than purely textual
representations?
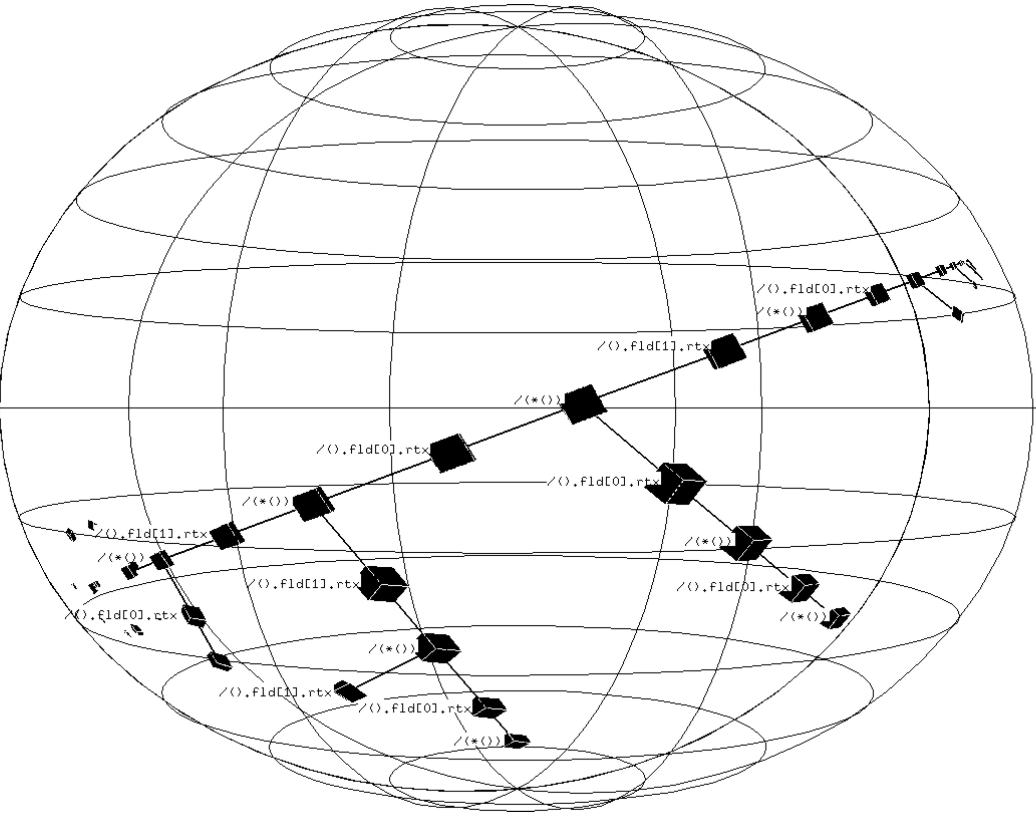
- What is the paper's proposed solution to the "bird's nest graph"
problem with program visualizations, which is that the many
crossing lines make the depicted graph difficult to understand
- programs have neither intuitive appearance nor physical form.
what info to show? How to depict it graphically?
How to position it within 2D or 3D space?
- Proposed static analysis: from source code, generate an
"intermediate file" containing:
- list of source files
- list of functions in each file
- for each function, a list of calls to other functions
- "data structures"
(Hirose note: "intermediate file" format might make sense for
multiple/many languages, allowing subsequent visualization on
all of them).
(Jeffery note: many tools have been written to extract this before,
might not have to do it from scratch)
- don't ask the user to place all the objects -- too much work
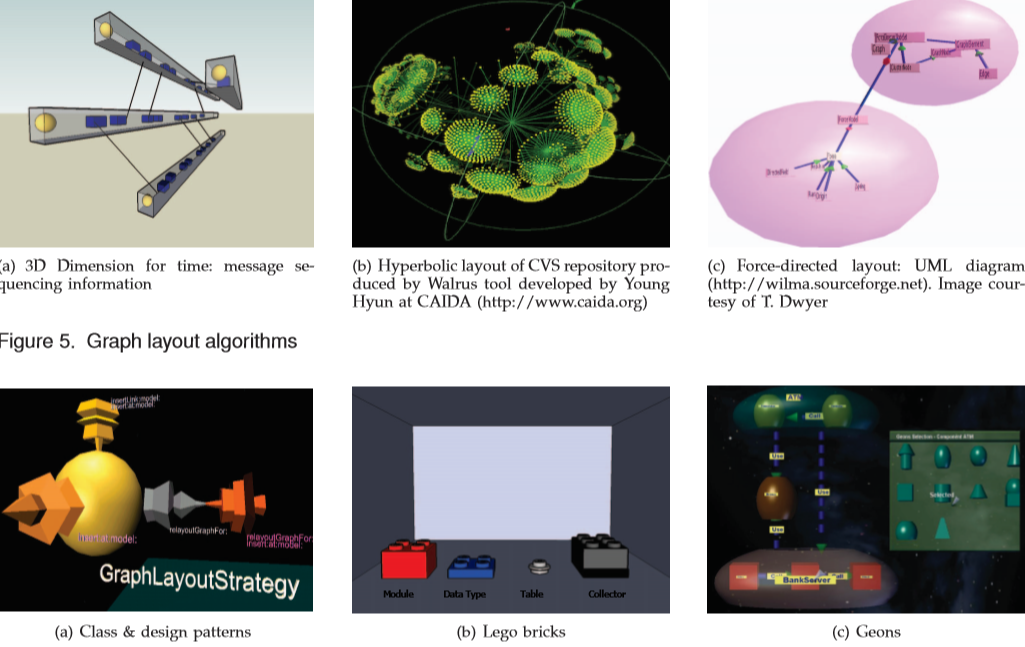
- force-directed placement algorithm:
- each object exerts a repulsive force on every other object
- relationships between objects exert attractive forces
- model it as a physical system, start with random positions
within a small space and turn forces loose.
layout is finished when it reaches equilibrium
- Fundamental in visualization: too much information. Too complex. Need to
select/simplify/abstract. For example: merging similar entities,
omitting peripheral ones.
- Levels of abstraction, levels of detail. At a distance: only show
external coupling. From close up: object becomes transparent,
source code is visible.
- Color-coding : a limited, extra dimension. Example: color GUI
components red, database components green, computations blue.
Example: distance from main() (or current point of execution)
indicated by brightness/saturation/grayscale. Hirose does not
note the significant percent of users with some colorblindness.
- Geometric appearance. E.g. size and shape. Hirose uses cubes
sized to the log of the #lines of code. Shape is another limited,
extra dimension that can be used.
- Does VR matter? What impact do VR goggles or a CAVE have on users
ability to understand the information we want to depict in this class?
Cheesey Movie References
What movies present topics relevant to this class, i.e. program
visualization, program behavior monitoring, or virtual environments
where such activities occur?
- TRON
- Disclosure
- Ready Player One
Graphic Design Principles
We need graphic design principles in preparation for visualization work.
The following can be attributed to Edward Tufte, a renowned ivy league
graphic designer who has written some beautiful books.
- show the information
- show as much as you can with as little ink as possible
- remove ink that isn't showing useful information
- remove redundant information
- revise and edit
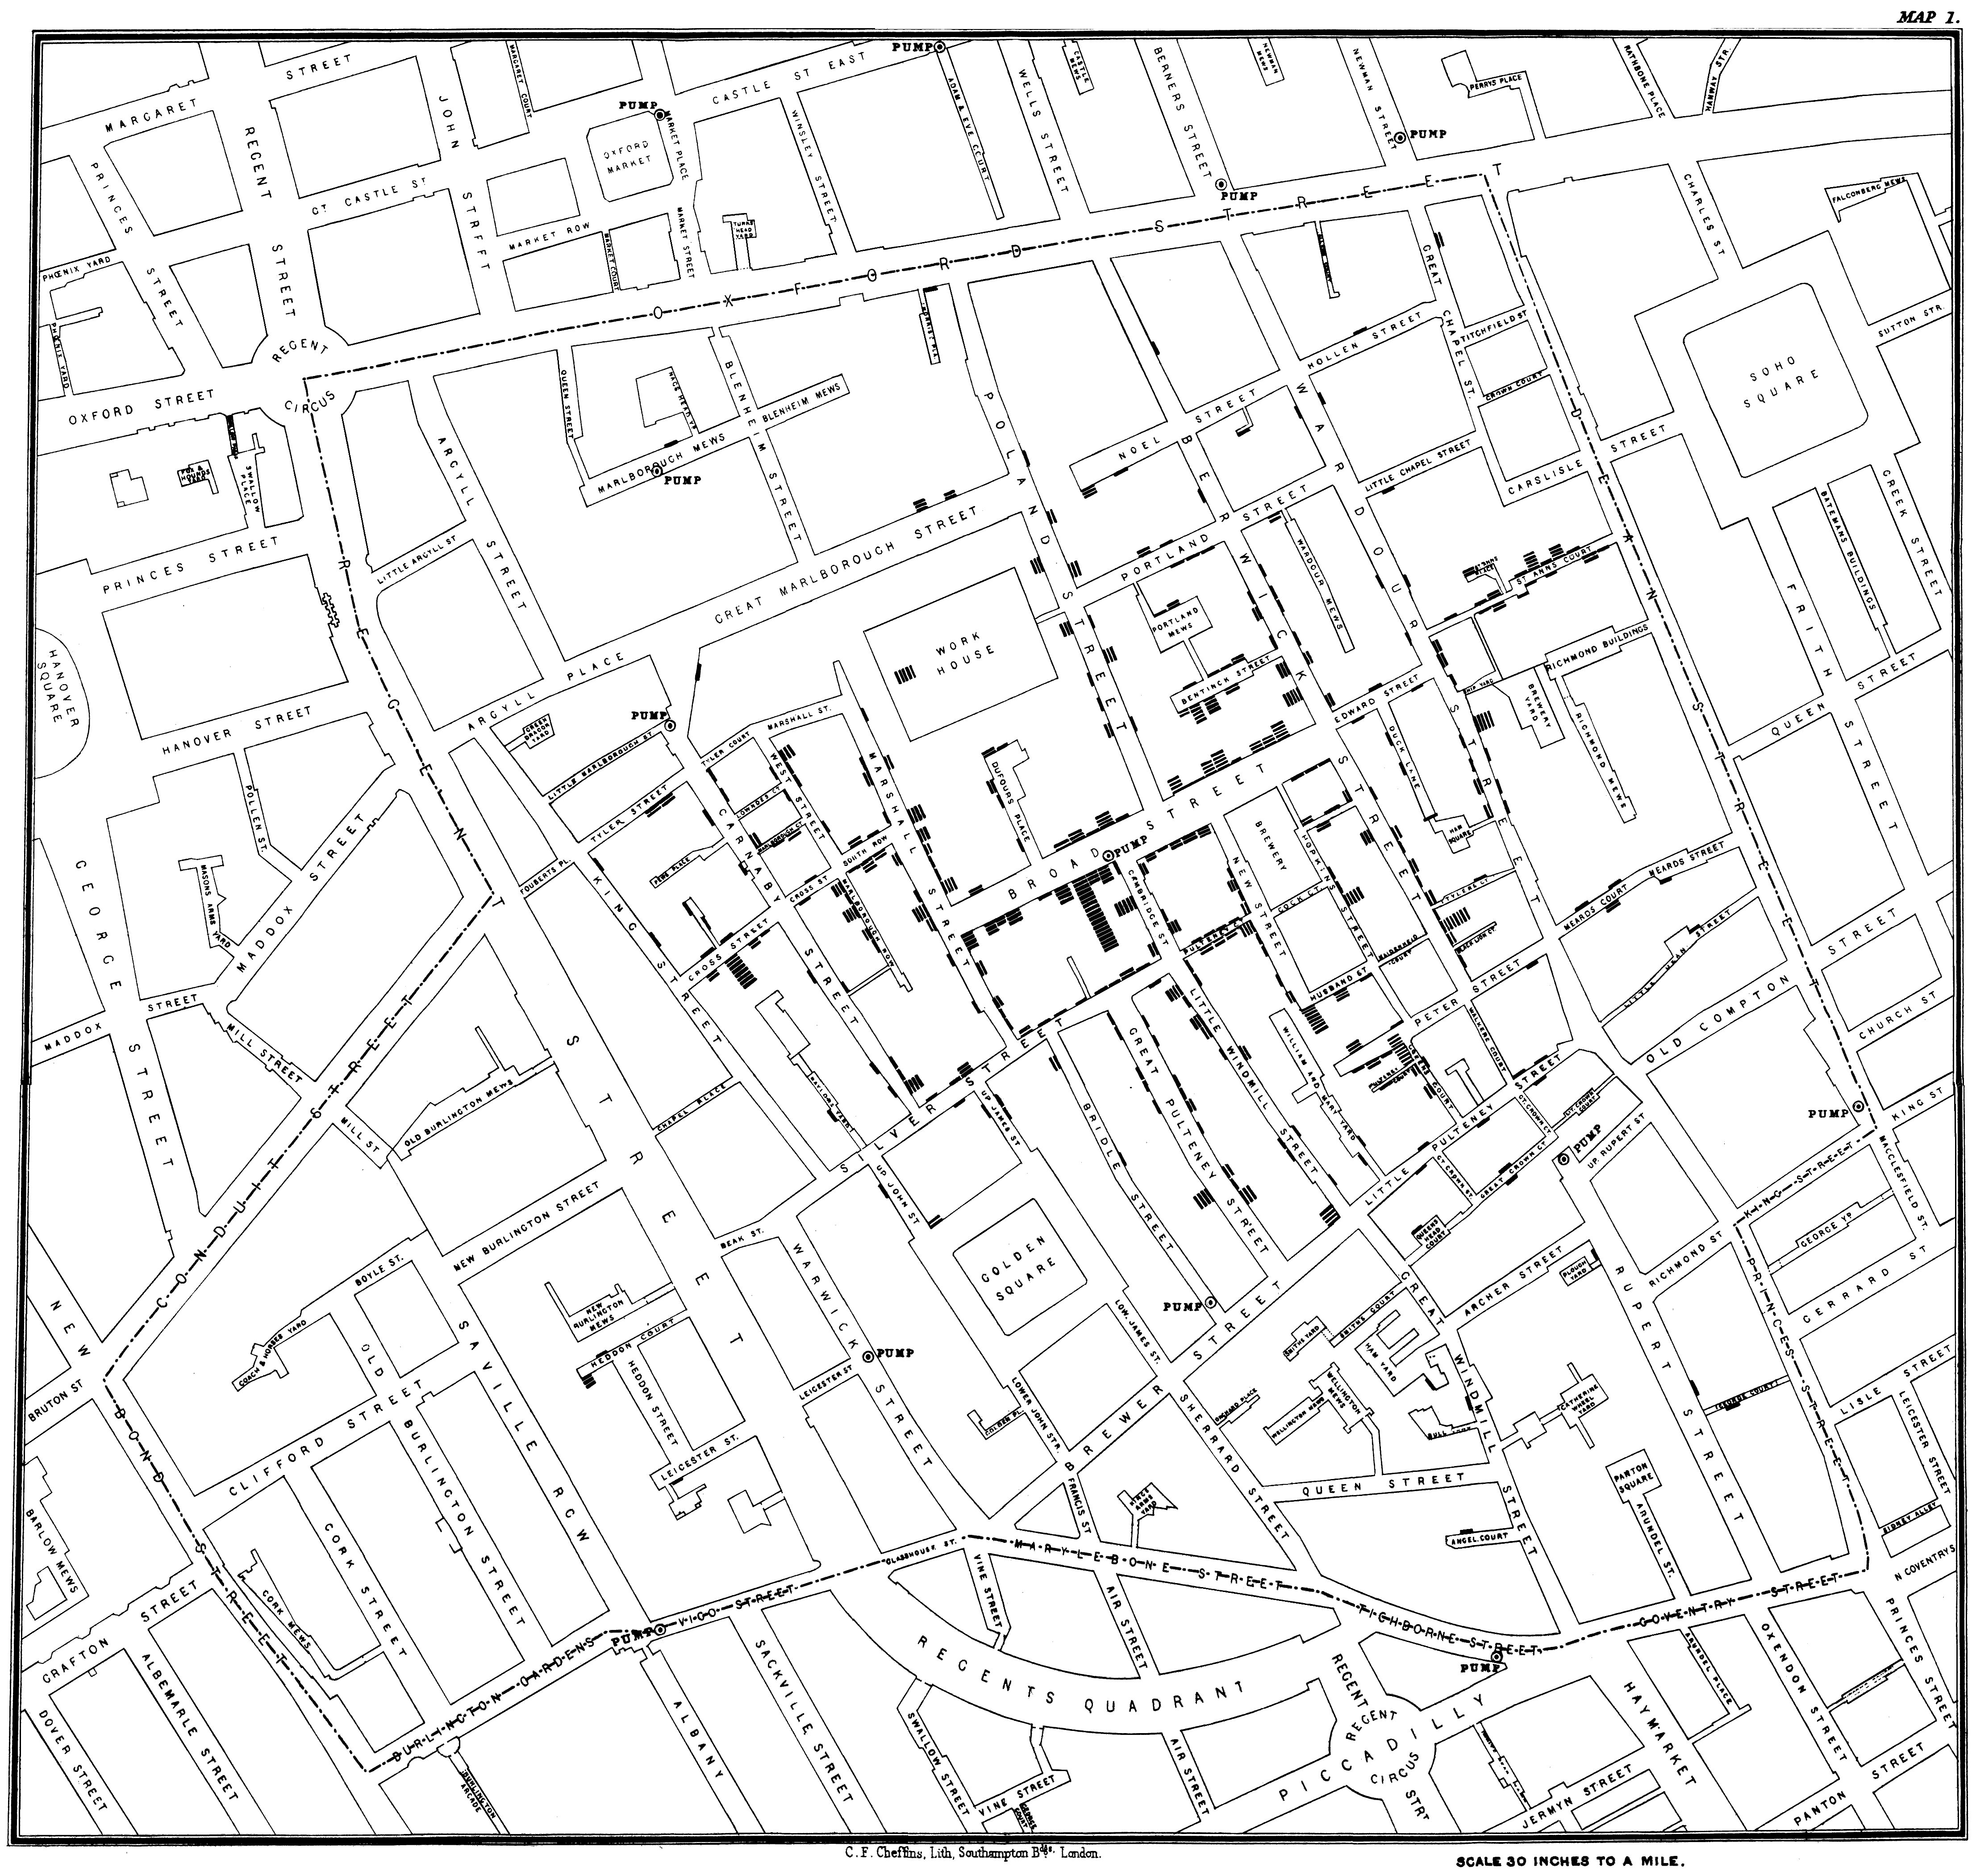
Graphic Design of the Day: a scatter plot
A map of London by John Snow, 1854, cleaned up by John Mackenzie
of the University of Deleware.
lecture 4
Mailbag
- I am having trouble using the star operator on lists, *L
- The size operator *L works only after L has been assigned a list
value.
L := []
- How do I check if a string is not in my list of strings?
- Well, first off, if one were doing this a lot maybe one should
use a set instead of a list. Unicon has a set type. But for
occasional use on lists of reasonable size,
s==!L tells
if s is in the list L. s ~== !L is not so good, it will
almost surely succeed unless every value in L is s. Instead use
not (s == !L)
Unicon: the next level
Let's peek at
CS210 lecture notes on Unicon to see if I missed any highlights
during the live demo.
Monitoring Buzzwords
Volume, dimensionality, intrusion, and access. Solve these four
unsolvable problems and you've got the makings of a decent
monitoring and visualization framework.
- volume
- if you think static analysis of source code has a lot of information
the programmer may have to understand and/or deal with, wait until
you see the amount of information dynamic analysis generates. Even
small, short-running programs can generate millions and millions
of events of interest. Monitoring and visualization tools have
to filter/discard, condense/simplify, and analyze their input,
turning low level data into higher-level information.
- dimensionality
- understanding program behavior involves many dimensions:
control flow, data structures, algorithms, memory access patterns,
input/output behavior... Visualizations can be selective, but often
want to depict more than just 2 or 3 dimensions' worth of data even
though they are using a 2D (or 3D) output device.
- intrusion
- The act of observing program execution behavior changes that behavior.
Monitors have to minimize/mitigate this or they will be visualizing
their own side effects more than the thing they purport to show. The
first form of intrusion is to skew the timing of the observed behavior.
Monitoring a program may also alter its memory layouts (e.g. on the
stack), which might make bugs disappear (or merely exaggerate them).
- access
- Simple monitors might graphically depict exactly the information contained
in the sequence of events that they deserve, but most monitors need to
ask additional information, by accessing potentially the entire state of
the program being executed.
Graphic Design of the Day: Line Plots
Multiple dimensions of weather along a primary time axis.
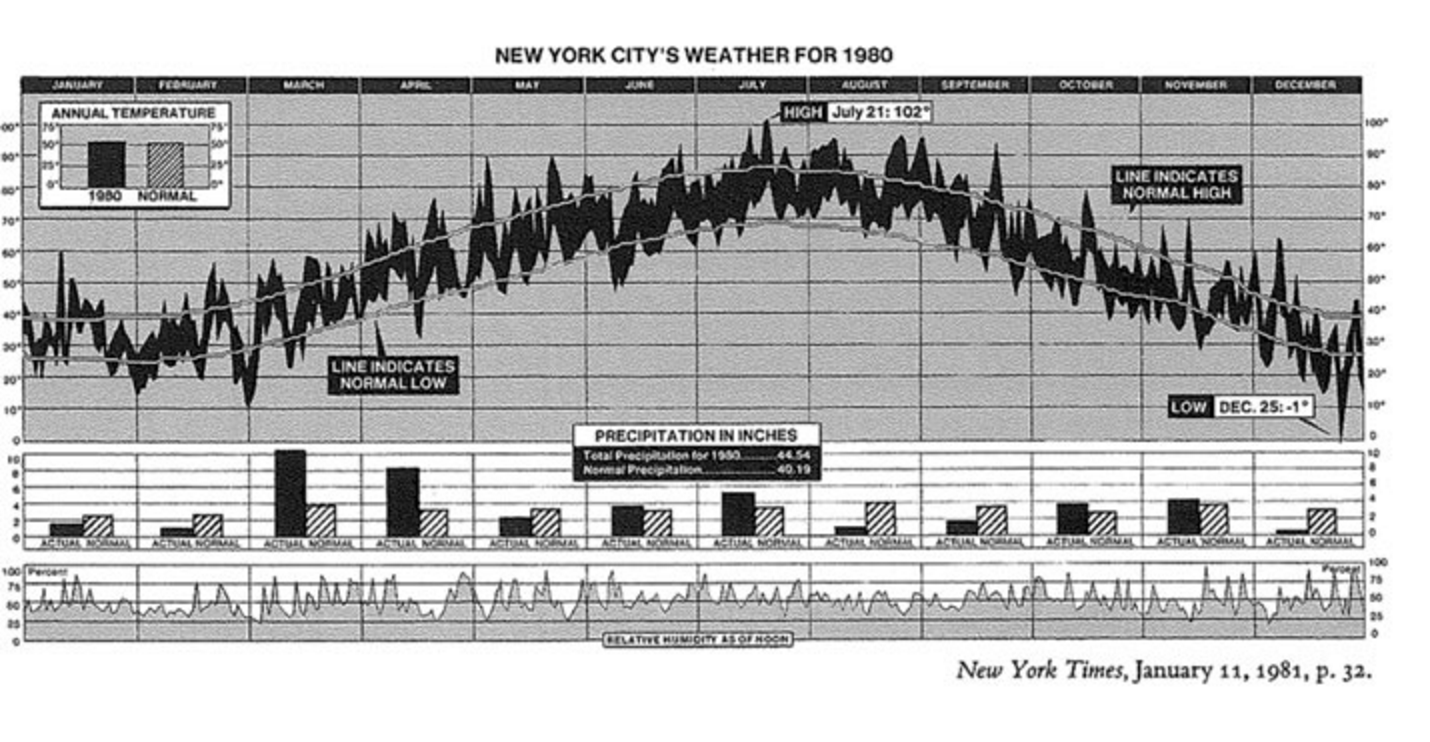
From the New York Times, popularized by Tufte.
lecture 5
Announcements
- Regular office hours: after class MW 2:30-3:20. Also by appointment.
- UI closed - no class on Monday
Surprised by Failure?
- Don't be surprised when fallible expressions fail.
- Failure in Unicon isn't a rare event like an exception,
- Failure is part of every program's life.
- You should learn to know how to identify fallible expressions.
- Expect failure. Write code to accommodate it.
When to check for failure: everywhere that failure can occur, and
everywhere that failure will matter. Examples:
- comparisons are designed to fail, most folks don't miss these
- type conversions like integer() are also designed to fail
- open() and similar system functions that ask for an operating
system resource that might not be available -- check them!
- find() and similar built-ins, UNLESS you can prove data is valid
- subscripts, unless you can prove valid index ranges
Graphic Design of the Day
William Playfair's chart depicting area, population, and tax revenues
of countries in europe is another excellent example of depicting multiple
dimensions of data.
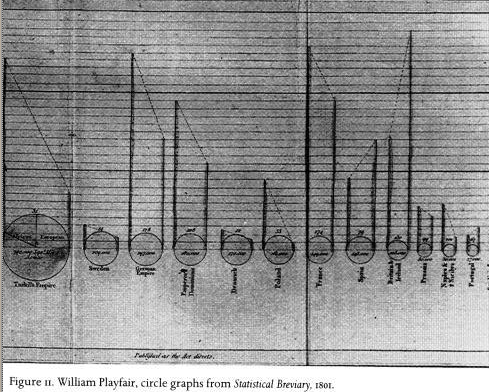
The slope between the population and tax revenues points down for most
countries and sharply up for England (and less so, for Spain).
Introduction to Unicon Monitoring Facilities
- events
- billions and billions of tiny points in time, with a tiny data payload,
and the ability to easily inspect the entire program state. Event names
like E_Pcall or E_Lbang
- event keywords
-
&eventcode and &eventvalue
- built-atop co-expression data type
- threads that take turns.
AKA coroutine, goroutine, or co-operative or synchronous thread.
- the VM is instrumented for you
- asymmetric coroutines. VM C code sends events to monitors written in Unicon
lecture 6
Reading for this week
- What does the paper claim is the distinction between 3D and VR?
- Research issues:
- What are the most efficient methods to
visually represent software systems?
- What are the perceptual
limits of these visualization with respect to large software
systems?
- How do we represent static and dynamic information
about the software?
- What are the user's most important information
needs with respect to particular software engineering tasks?
- What features are most suited to supporting collaborative problem
solving in this domain?
- What software engineering tasks benefit
(most) from this collaborative environment?
- VRML - late 90's, expected to be a big hit follow-on to HTML, did the
static part OK but didn't solve well the need for dynamics.
- "Imsovision" - class as a rectangular platform, methods as columns
(laid out how?)
- Did you notice
system(s) and open(s, "p") ?
- Built-in structure types as the associations between objects
Dr. J's intro to OO design was a user ...
- Classes
- Windows
Notes from Past Students' Unicon Program Visualizations
- "Longer" is not better.
Writing good Unicon is like haiku or other short poetry.
Practice toward mastery of the art.
- Avoid platform-dependent colors - stick to the portable color
names (see Unicon Graphics Book) or use RGB values.
- avoid platform-dependent fonts - stick to mono, sans, serif, typewriter
- do not assume that the display is larger than 1024x768*
- put your name in a header comment at the top of your homework
- check user input for validity, avoid crashes
This version is based on one by Mike Wilder.
lecture 7
How's the Homework Going? Any questions?
Things that might be useful:
Let's look at the code from this sorting visualization,
based on one by Mike Wilder. Start at the bottom, with main().
- You've seen
!x before, but how about x ! y
-
x ! y is the apply operator. It calls function x
with parameters given by the elements of list y.
lecture 8
Reading for this Week
- Bonyuet/Ma/Jaffrey, ICWS 2004
- Basic PC GPUs existed by this time; World of Warcraft came out in 2004.
- Key Criteria: usefulness, intuition, and scalability
- What were their definitions for these?
- Schneiderman's 7 tasks
- overview, zoom, filter, detail-on-demand, relate, history, extract
- CodeMapping achieves: labeled "atomic metaphor" 3D graphs.
- did they achieve their key criteria?
Introduction to Unicon Monitoring Facilities, Part 2
- built-in function
EvGet(c)
- Activates
&eventsource (Monitored) to get next event whose code is of type c
- event codes and masks
- an event code is a one-letter string. an event mask is a cset.
This is, literally, just grad-student-drj exploiting the handy
bit vector implementation that was in Icon.
-
link evinit
- library function EvInit(argv) loads program
-
$include "evdefs.icn"
- include file evdefs contains definitions of event codes
Writing your first Unicon monitor
Consider the beauty and virtue of m0.icn,
m1.icn and events.icn.
Now checkout sos.evt
lecture 9
Windows Unicon Trouble?
- Windows Unicon wasn't running for one student due to a long PATH
environment variable. On current Windows you can pretty much set
a path arbitrarily long, but for a new process to see it there is a
length limit (2047 characters, possibly less).
- Windows Unicon bug reports are extremely welcome; please send me
cut/paste console messages or screenshots...
Summary of Event Monitoring Libraries
From unicon/ipl/mprocs
- evinit
- EvInit(args) loads another Unicon program that is to be monitored
- evnames
- evnames(e) maps event codes to English, e.g. E_Pcall -> "procedure call"
- evsyms
- returns a table that maps codes to symbols t[E_Pcall] -> "E_Pcall"
- ...
- there are several more that we will introduce as needed
From unicon/ipl/mincl
- evdefs.icn
- $defines for all 100+ event codes. We should probably tour this.
- patdefs.icn
- $defines for the ~100 integer &eventvalue's of the E_PatMatch event
Subject to some tweakage, here it is.
Unicon 2D Graphics Functions
We briefly discussed the built-in 2D graphics function set.
Functions you might have a use for in this class:
- Bg - get/set the background color
- CopyArea - copies a rectangular area
- DrawArc - draw a partial or complete oval
- DrawCircle - draw a partial or complete circle
- DrawCurve - draw a smooth curve through points
- DrawImage - draw an image from a ASCII-art string representation
- DrawLine - draw one or more lines
- DrawSegment - draw connected lines
- DrawPoint - draw points
- DrawPolygon - draw a polygon
- DrawString - draw text
- DrawRectangle - draw a rectangle
- EraseArea - fill a rectangle with the background color
- Event - read the next keyboard or mouse event
- Fg - get/set the foreground color
- FillArc - draw an arc filled with the foreground color
- FillCircle - draw a circle filled with the foreground color
- FillRectangle - draw a rectangle filled with the foreground color
- FillPolygon - draw a polygon filled with the foreground color
- Font - set the font
- GotoXY - set the text cursor to pixel (x,y) based on current font
- Pattern
- Pending - return the list of pending user input on this window
- QueryPointer - obtain the current mouse location
- ReadImage - read an image from a file into a window
- TextWidth - return the # of pixels wide a string is in the current font
- Texture
- Texcoord
- WAttrib
- WDefault
- WFlush
- WSync
- WriteImage
3D Functions We Will Worry about Later
- DrawTorus
- DrawCylinder
- DrawDisk
- DrawCube
- DrawSphere
- PopMatrix
- PushMatrix
- Rotate
- Scale
- Translate
Functions you probably don't need in this class:
- Active - returns a window with pending input
- Color - set a mutable color (color-index frame buffers only)
- Couple - bind a canvas from w1 to a context from w2
- FreeColor - free a mutable color (color-index frame buffers only)
- GotoRC - set the text cursor to (row,column) based on current font
- NewColor - allocate a mutable color (color-index frame buffers only)
- PaletteChars
- PaletteColor
- PaletteKey
- Uncouple
lecture 10
Unicon Mailbag Questions
- How does open mode "p" work?
- You don't have to use it you can do anything that you find works for you.
But open(cmdline, "p") runs cmdline in a shell and opens a file that reads
its standard output into your program.
| Linux Example | Windows Example
|
|---|
f := open("ls -l | grep icn", "p")
while filename := read(f) do stuff(filename)
close(f)
|
f := open("cmd /C dir", "p")
while line := read(f) do
   if find(".icn", line) then stuff(line)
close(f)
|
- how would I make global lists or tables that I can access in other procedures?
-
- Declare global variables.
- Assign them list or table values (maybe in main())
- They will then be visible everywhere.
Partial Highlights from HW#1 Solutions
    outfile := open("output.json","w")
	# OK, but check whether open() fails or not

    s := f(s, "morestuff")
    	# functional style is fine and appropriate. no reference parameters.

    L := []
    every put(L, !fileIO)
	# OK, but consider L := [: !fileIO :]

    truth := 1
       ...
	    if truth = 1 then {
	# fine, use boolean flags if you must. no boolean data type.
	# More common to use &null as false and non-null as true.

     every x := find("(", line) do {  #finds every instance o
     	# outstanding; uses find() to iterate through line

     if not member(&letters ++ &digits, line[x-1]) then {
     	# fine, but if you do this a lot of times, pull ++ out of the loop

     hashIndex := &null
     hashIndex := find("#", line)
     if hashIndex ~=== &null then{
     	# fine, but consider
	#   if hashIndex := find("#", line) then { ...


     system (["cflow", "--omit-arguments", name], f, f, f3)
	# wow, kudos for using the full power of system()! Is this better than
	#   system("cflow --omit-arguments " || name, f, f, f3)

      word := tab(upto("("))
	# kudos for using string scanning!
	# consider using tab(find("(")) or change to tab(upto('(')))

      every i := 1 to *args do tableofprogs[args[i]] := preprocess(args[i])
	#  every arg := !args do tableofprogs[arg] := preprocess(arg)

      p := <[_a-zA-Z][_a-zA-Z0-9]*[ \n\t]*"(">
      p2 := p || .>y
      s ?? p2 -> s2
	# wow, regexps and patterns!

      if s2[j] == (" "|"\n"|"\t"|"(") then {
        # if any(' \n\t(', s2[j]) then { ...

      system("cflow  cflow.c > info.txt", "p")
	# hmm, possible mixed metaphor

      if(pos ~== 0 ) then
	# if pos ~= 0 then

      if(lenghtOfString(L[i]) = 1 )then {
	# not just misspelled, also misleading

      wchar := &letters ++ &digits ++'\'_'
      lista ? while tab(upto(wchar)) do {
	# this is good practice

      n_pos :=  find("()", p_name)
      f_pos := find(")", p_name)
      if  p_name[n_pos] == "(" then {write("nice")}
	# better know for sure that these can't fail, or check

      procedure getSpaceNumber(line)
      local pos:=0
        space := line[1]
        while (space == ' ') do {
          pos := pos + 1
          space := line[pos]
        }
        return pos
      end
	# many(' ', line)

      if not (tab(find("class"|"procedure"))) then {
	# cool

      &pos := &pos + 6
      	# move(6)

      lineno=0
	# lineno := 0
Visualization Principles (according to Dr. J)
- animation
- incremental algorithms are a primary means of achieving efficient
animation. complementary to the principle of minimizing ink (or # pixels)
used to
convey a given set of information, this is like minimizing the
motion of the plotter arm, or in our case, the # of memory writes.
- least astonishment
- use the golden rectangle, labels and legends
- metaphors
- a familiar metaphor saves the user a lot of time and improves
understanding. Metaphors can be taught, and become familiar over time,
but that is often laborious.
- interconnection
- connecting different pieces of data is key, follow Playfair's example
- interaction
- the big difference between a visualization and a paper chart or graph
is that the user can interact with the data. exploit this.
- dynamic scale
- visualizations compete for screen space and hardware varies widely.
it is extra work, but if you write everything so that it scales, your
visualization will be useful on more machines and in more ways.
- static backdrop
- one of the best ways to make dynamic data understandable is to present
it in terms of static data. An execution is an instance of the underlying
universal abstract thing that is the program.
Notes from Past Students' Unicon Code
-
main(av)
- av is always a list of strings; if no arguments, *av = 0
-
paramnames() is a generator
- use it with
every, or ask questions like "if type(x:=paramnames(...))=="list" then..."
- the apply operator
p ! L is pretty awesome
- what does
every maxval <:= !L do?
-
max() is a built-in function, so maxval := (max ! L)
- failure and success
-
if i := find() then ... is cooler than i := find(); if \i then ...
- check for
open() failure
- I asked nicely before, now I am telling you
- sticking
&fail at the end of a routine is a noop
- a routine fails for free if it falls off its end;
&fail
does not return a failure and is in fact seldom used.
Unlike lisp, the return value of a function is not its final expression's
evaluation.
Graphic Design of the Day
Fisheye Views.
If you want, you can read Furnas' paper on
Generalized Fisheye Views.
As we proceed into the "meat" of the course, we have a need for lots
of subject programs to study, lots of example monitors, and bigger
programs that presumably will have more complex behavior.
- Suspects
- This directory was compiled by Ralph Griswold as a collection of
interesting or weird programs whose behavior could be understood
by program visualization. The good part of the Suspects directory
is that the programs all run non-interactively, in some cases they
were modified to do so, and those that require input have sample
.dat files on which they run nicely. This lets monitors do their
thing unimpeded. We should probably add some representative
object-oriented programs to this collection this semester. I probably
can dig out my "gui recorder" and create recordings of GUI programs
so that we can monitor them conveniently in this context.
- tools
- This directory was compiled by Clinton Jeffery as a collection of
simple program visualization programs and library procedures. Many
of these codes are featured in the book, Program Monitoring and
Visualization.
- Big Programs
- The largest programs in the suspects directory are typeinfer (2.6k lines),
and yhcheng (1.9k lines). These were considered large in the Icon
language, where source codes are typically 1/3 to 1/10 the size of
C programs that do the same thing. The other largest public domain
Icon programs are in the ipl/*packs directories. Among these,
ibpag2 is 3.7k lines, itweak is 3.5k lines, skeem is 3.1k lines,
ged is 3.6k lines, htetris is 4.3k lines, vib is 4.4k lines, and weaving
is 11.3k lines (?). Monitoring these might or might not be easy, since
they may be interactive, and you might or might not know what to click
at them in order to get them to behave. The largest known Icon programs
(source not available) was Bill Wulf's testcase generator (rumored to
be on the order of a half-million lines, perhaps machine-generated.
The Unicon language supports larger programs than Icon was intended for.
The unicon translator itself is 10k lines of Unicon.
The uni/lib class library is 20K lines, and the uni/gui
GUI class library is 14.5K lines; large subsets of these libraries
may be added onto whatever the tool size is. The Unicon IDE is 17K
lines, the IVIB user interface builder is 16K lines, and so on.
Some of these you can acually monitor.
The largest Icon/Unicon programs for which I have source code
include the SSEUS database review/update system (35K lines), and a
Knowledge Representation language and system (50K lines) done by an
AT&T scientist. It might be possible to find these and monitor
them, but it would take work to set them up for monitoring.
lecture 11
Mailbag
- How can I set the width and height of the string that I print with
DrawString() using the values height and width from the dot
output?
- Great question. Text labels are going to be important all through this
course. Visualizations often botch them: either not enough, or too many to
the point they are unreadable.
- Unicon fonts have height, ascent, and descent attributes that are
independent of what string you are trying to output. Units are pixels.
- Some fonts are fixed width, and some are spaced such that wider
characters use more pixels.
- The four portable font names are "sans", "serif", "mono", and "courier"
- You set the font with the
Font(s) function, or assign
it with WAttrib("font="||...).
- Typical font strings look like
Font("serif,14") or
WAttrib("font=sans,11,italics").
-
DrawString(x,y,s) draws s starting from (x,y).
- If you
link gpxop you get a procedure
CenterString(x,y,s) where s is centered at (x,y).
- There are several calculations that might be relevant:
determine whether a given font will fit a given
(width,height) size, calculate what is the largest font that will fit,
or print only as many characters of a string that will fit, if the font
is not to get smaller.
Reading
Highlights from OGRE [Milne/Rowe 04]
- topics related to memory are the most difficult
- pointers, dynamic memory allocation, copying, polymorphism...
(9/10 of the most difficult topics for novices identified in
a previous paper)
- [Knight and Munro 2000] "Software World" sounds interesting.
- Not assigned as homework/reading. It proposes a city metaphor in
which:
- each class is a "district" and each function is a building.
- The height of the building gives the source code size in lines.
- Building exterior color shows visibility (light=public, dark=private).
- Outside doors indicate parameters number and type.
- Object-oriented systems can be harder to understand than traditional
imperative code.
- So maybe it would be more important for us to figure out how to visualize
them.
- A conceptual view is needed more than a literal view of memory
- At least for novices, sizing each object to its # of bytes is not the
main point.
- Understanding scopes is important. Each one gets a plane.
- Local scopes are mostly extremely numerous and short-lived.
We need a metaphor in which these "planes" or sets of variables/objects
come in together in a rush, and leave together with a wimper. A lot.
We are looking for a metaphor for the stack. Of course, we could depict
them as a stack. Pancakes? Waffles?
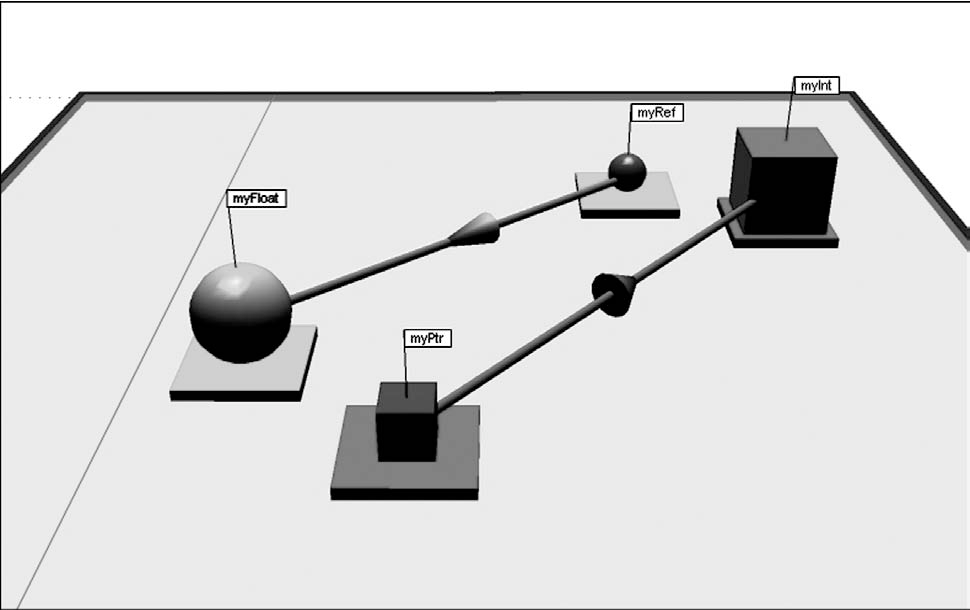
Note OGRE's target: novice C++ programmers who need to develop a very
concrete mental model of how pointers work.
More Unicon highlights from HW#1 code?
      if first:=find("at ", line) & lineNumb==1 then{
         move(first+2)
		# what's the difference between tab() and move() again?
	# extremely common: tab(find(...)), tab(upto(...))

      while move(1) == " " do {
         count:=count+1
      }
	# count +:= 1 ok, but how about count +:= *tab(many(' '))
Graphic Design of the Day
CASSE POSTALI DI RISPARMIO ITALIANE by
Antonio Gabaglio, via the revered Tufte, and cited in
a nice discussion of cyclic data, apparently by Benj Lipchak.
Unicon feature of the day: Packages
Packages were added to Unicon more or less against my will,
but they are obviously of growing importance in larger scale
development. Packages are about protecting a name space from
collisions. Without them, global variables in all modules
are shared, and accidentally, these variables may conflict
with globals (and undeclared, thought-to-be locals!) in other
modules. The more libraries you use, the more inevitable these
conflicts. Proof that packages are needed is evident in the
Icon Program Library, where, after fundamental built-in functions
like "type" were accidentally assigned one too many times by
client code, Ralph Griswold got in the habit of protecting "type"
or similar built-in functions the hard way, inside each library
procedure that uses them:
   static type
   initial type := proc("type", 0)	# protect attractive name
This gets old in a hurry, and it actually bloats code a little bit.
So anyhow, Robert Parlett implemented packages, and I accepted them,
and now they are here to stay, and they aren't bad. You do have to
know the "package" and "import" keywords, and the ::foo syntax, and
that is about it.
lecture 12
Mailbag
- I am stuck trying to parse dot output. For example, if I have a string
s == " a -> b [pos=\"e,63,108.41 63,143.83 63,136.13 63,126.97 63,118.42\"];"
how do I parse it?
- Well, obviously we are still learning Unicon and I will take whatever
bloody harvest of bytes you manage to deliver me. But if I had to do this
homework, I might start with something like:
   s ? {
   tab(upto(&letters))       # discard up to node name
   srcnodename := tab(many(&letters))
   tab(many(' \t'))          # discard whitespace
   if ="->" then {           # we have an edge
      tab(many(' \t'))       # discard whitespace
      dstnodename := tab(many(&letters))
      tab(many(' \t'))       # discard whitespace
      if ="[pos=\"e," then {
         L := []
	 while num := tab(upto(', \"')) do {
	    put(L, numeric(num))
	    if ="\"" then break
	    else tab(many(', '))
	    }
         }
      else write(&errout, "malformed edge")
      }
   }
- I am stuck trying to use
DrawCurve(). From
reading the book, I understand that the arguments need to be x,y pairs. My
issue is when I try to pass DrawCurve() a string or a list as
an argument containing all of the x,y pairs. For example a string or list
containing [127.7,180.41, 127.7,215.83, 127.7,208.13, 127.7,198.97,
127.7,190.42]. I am assuming the string or list gets treated as just one
argument when I do this, is there something else I can do?
DrawCurve() and the other Draw*() functions do
not take their parameters in a list or a string. If you have all your
arguments in a list L, you can turn them into parameters using
the apply operator, as in DrawCurve ! L
cflow on Windows
If you dare, check out
https://github.com/noahp/cflow-mingw.
It is either a nice guy who built cflow on Windows and shared it with the
world, or a nefarious ransomware hacker luring victims with offers of
cflow binaries. If you don't like trusting his .exe's you can certainly
examine the source code and try to follow this github project's build
instructions. How I found it: googled cflow.exe. Random github is not
a highly reputed official distribution, but at least with source
code it is not obviously one of those codehosts of ill repute malware
sites, like a fake device driver repository.
dot on Windows
There have been reports of problems running dot on Windows. graphviz.org
provides windows executables and dot.exe seems to work OK. Maybe it
conspicuously chooses not to add itself to your PATH; adding the directory
where it was installed to the Path got it working for one student. In
another student's case, instead of open("dot ...", "p")
we ended up using open("cmd /C dot ...", "p"). That smells
also like a Path issue, but I am not sure.
Monitoring Location Events
-
E_Line events show line # changes
-
E_Loc events contain line, column, and a syntax code.
Somewhat more frequent than E_Line.
- to get line # out of an E_Loc:
iand(&eventvalue, 65535)
- to get column # out of an E_Loc:
ishift(&eventvalue, -16)
(actually, maybe a bit trickier)
Vizualization Idea:
- map line #'s to y coordinate, one pixel per text row.
- map column #'s to x coordinate, one pixel per text column
- aggregate ALL events at a coordinate to a color. that way,
nothing has to move, it just gets "hotter" over time.
The program miniloc.icn is a "miniature location profiler". It is our
first example from the tools/ directory mentioned in
an earlier lecture. It is 66 lines of code.
What is "mini" about miniloc is that each source code line and column is
one pixel row and column. This is a scaling problem for large programs
or small monitors.
Miniloc could be rewritten to scale its graphics. The frequency of
location events at various locations is recorded using a log scale
through a range of colors from boring to red-hot. Humans
don't really perceive red as a larger # than green, but the metaphor
of a temperature map is widely recognizable anyhow.
lecture 13
Reflections on Miniloc
My first thought after briefly running miniloc last time was:
- I need bigger dots (for legibility on TV's).
After sleeping on it, additional ideas came calling:
- How hard is it to adjust the scale interactively?
- How hard is it to tell how many lines/columns this viz.
needs to be able to scale to show the whole file?
- I wonder how big the dots have to be before I could just be printing text?
- I wonder how to scale miniloc to programs with (many) files?
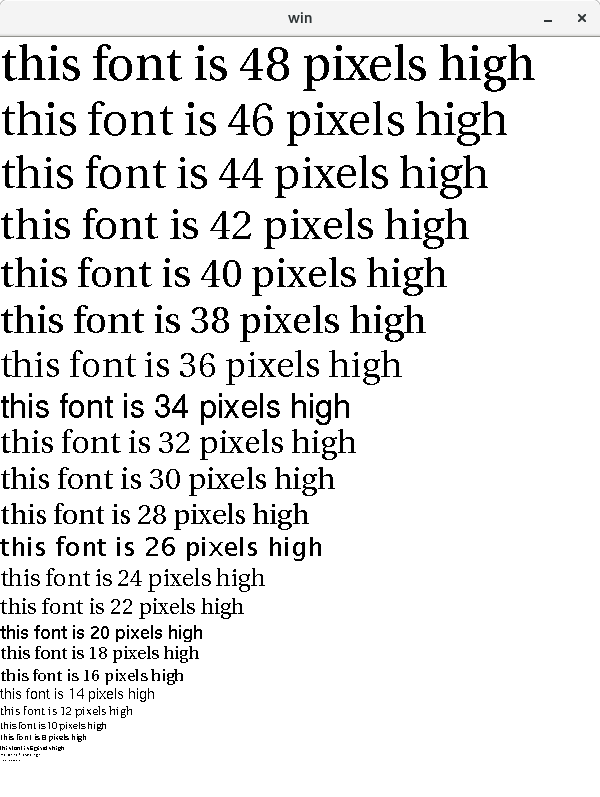
For the small-font legibility question, we might take a look at this
font demo.
- What is the smallest row you can read?
- Below that point, illegible font shapes drawn might still be useful
for miniloc's purpose, which is to be a "mini-map" of the code.
- my problem last time wasn't just small dots on a TV screen
- the copy of miniloc.icn I showed you hadn't been
updated when the
E_Loc event was enhanced for
Ziad Al-Sharif's Ph.D.
- I have too many copies of the execution monitoring tools, on
too many machines
- This is a great argument for placing them under revision control
Bigger Questions
- How much more static information will we need, e.g. beyond the
function call graph? What types?
- Does that "static" information include source code?
- How much could we get if wanted to not depend on source code?
Vizualization Idea:
- map line #'s to y coordinate, one pixel per text row.
- map column #'s to historical sequence of line numbers,
show last (K) events, where K=width of window in pixels
- wrap around when you get to K+1'th column (why?)
Hani's Clever Case Tag
Case expressions in Icon use === semantics, looking for an exact match with
no type conversions. Case branches are evaluated sequentially as if one
were writing
  if x === firstbranchexpr then firstcodebody
  else if x === secondbranchexpr then firstcodebody
  else if x === thirdbranchexpr then firstcodebody
  ...
If all the branch labels are constants, this is colossally inefficient
compared with a C switch statement. But, it is fully general and you
can use arbitrary expressions, including generators, for which the entire
result sequence will be generated in trying to find a match.
You can add a predicate filter on the front, or have your values supplied from
subroutines, or whatever:
   case x of {
   p() & q() & foo: { ... }
   a | b | 1 to 10 | f(): { ... }
   }
This generator capability can be used with cset event masks, as in the
following; it would also work with sets, table keys, or any other generator
you wanted to write.
case x of {
   ...
   !ProcMask: {
      }
   ...
   }
This makes for short elegant code, but it is inefficient. Generating
the individual elements out of a cset costs a type conversion (cset to
string) which isn't cheap, and all generators pay for extra bookkeeping
on the stack, for that suspending resuming capability, which is slow at
times. You are paying for convenience and generality, and a good
optimizing compiler might make some of that go away, but the VM sure
does not. In a couple minutes we will see another measure of how much
you pay. But in the meantime...
Hani Bani Salameh showed me some code once that looked like:
case x of {
   ...
   member(a_set, x): {
      }
   ...
   }
member(a_set, x) tests whether x is a member and returns
x if it is, so it is just a filter, and by the way it avoids a linear
search via a generator so it is fast. Its got a seemingly redundant
comparison of x===x after the member() test succeeds, but that is C
code and probably very fast compared with a case with a lot of alternation
| or generate ! operators in it.
lecture 14
Reading
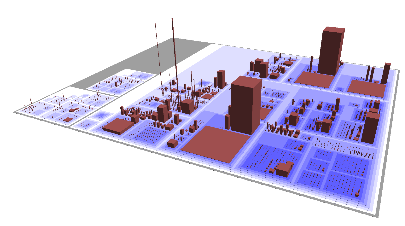
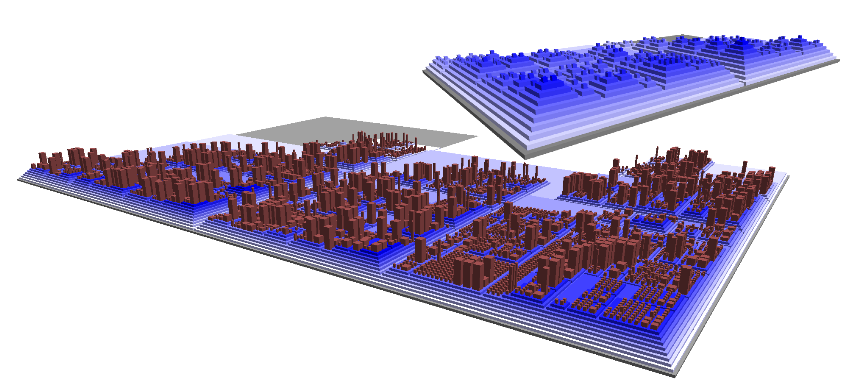
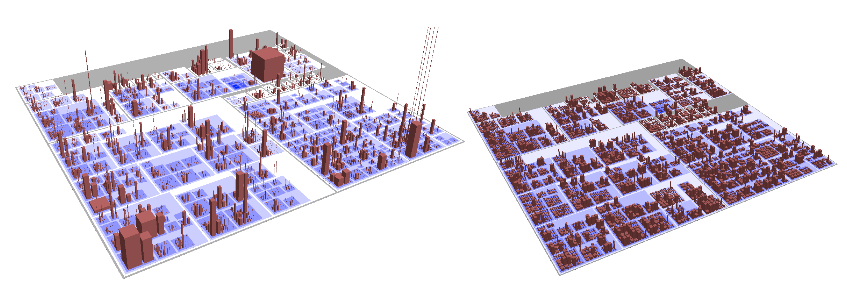
Highlights from [Wettel and Lanza]
- CodeCity
- classes and interfaces are buildings
- building height == # of methods
- width and length proportional to # of attributes (all square)
- position hue, saturation, and transparency are all available
to depict more information
- land topography/elevation depicts package structure
- Visualized on real, large systems, e.g. 8,000 classes
- Layout: largest first, splitting rectangles into pieces, treemap algorithm
- Studied software evolution in a repository
Monitoring Procedure Activity
- Procedure activity is a subset of the control flow behavior of
expression evaluation.
- It is related to but far coarser-grained than monitoring line#/col#
- In a normal language monitoring procedure activity
would mean monitoring the stack of procedure activation records
- In a multi-threaded context, there would be a set of stacks of
procedure activation records.
- Just looking at the stack, one might note how deep the stack
gets (not a problem unless it overflows) and look for patterns
that suggest bugs
- Can anyone think of a call-return sequence that suggests a bug?
- Besides correctness, you might imagine looking for performance
problems or tuning opportunities.
Monitoring Icon and Unicon is a little more complicated because procedures
can suspend and be resumed. The events for this behavior are given below.
The include file evdefs.icn defines an event mask named
ProcMask that will select all six of these events.
| Event | Value | Description
|
|---|
E_Pcall | procedure called | Procedure call
|
E_Psusp | value produced | Procedure suspended to caller
|
E_Presum | procedure resumed | Resume a previous suspension
|
E_Pret | value produced | Procedure returned to caller
|
E_Pfail | failing procedure | Procedure failed
|
E_Prem | removed procedure | Procedure removed
|
In the presence of suspend/resume, the "call stack" becomes a "call tree",
a.k.a. an activation tree (a better term since
procedures can be activated by more than just calls).
You can just ask for all the procedure activity events, but if your monitor
is doing more than just counting them then it potentially will need to do
more. One way to monitor the activation tree is to build a model of the
tree itself.
- a library procedure named
evaltree(), does this for you.
- you can
link evaltree to link this module into your program.
- study in detail the implementation of
evaltree.icn.
We will look at examples that use evaltree, but first a word on timing.
- Monitoring costs time.
- If it costs too much, folks won't want to do it even
if your successful program visualizations do make pretty moving pictures.
- The instrumentation of all events costs time even if you don't ask for the
event reports
- when you do ask for an event, the event report (co-expression switch)
costs a lot more time.
- It is difficult to even measure the timings of different parts of the
monitoring process.
- You may be able to do a good job by going into the VM C
code and using your own expertise, or using specialty tools for doing
timing, such as gprof.
- This discussion is just based on casual observation.
Example. In the suspects/ directory are many candidates (which one runs the
longest?). We will consider the poetry scrambler for this example.
time ./scramble <scramble.dat
uses the UNIX time(1) command to
measure the runtime externally. It reports something like:
| Sun Sparc, ~9/2007 | Threadripper, 2/2019
|
|---|
1.0u 0.0s 0:03 32% 0+0k 0+0io 0pf+0w
|
0.019u 0.025s 0:00.15 20.0% 0+0k 0+0io 2pf+0w
|
Over a decade ago, that program took 1.0 seconds of user time, 0.0 seconds of
system time, 3 seconds of wall-clock observed time. Out of curiosity,
since it writes out a lot to standard out, I re-timed it directing output
to /dev/null, and it still took a second of user time, but the wall clock
is down to 1 second.
Now I take an almost-empty monitor, timer.icn,
and time it using the UNIX utility.
time timer ./scramble <scramble.dat
and it writes out
| Sun Sparc, ~9/2007 | Threadripper, 2/2019
|
|---|
tp time: 1830 - 0 = 1830
em time: 0 - 0 = 0
1.0u 0.0s 0:03 30% 0+0k 0+0io 0pf+0w
|
tp time: 35 - -5 = 40
em time: 5 - 5 = 0
0.025u 0.018s 0:00.15 20.0%	0+0k 0+0io 2pf+0w
|
Given that timer.icn is the "empty monitor",
what do these numbers tell us?
- The time command doesn't see any appreciable extra time spent
due to the act of monitoring (in 1993 this would have reported
~50% slowdown for the privilege of having the instrumentation present)
- The "monitor" thread thinks it has spent no time at all (almost true)
- 2007 Sparc monitoring facilities reported the program is spending 1.8
seconds, versus system time's 1.0u CPU time, or 3sec wall clock.
- System time program in 2019 reports same overall time (0.15sec)
but fluctuates as to whether user or system time is more to blame...
[clock tick fluctuation?]
- Are threadrippers more like 6x faster than Sparcs, or is it more like 40x?
- CPU (user+system) is pretty routinely a small fraction of wall clock time
- Which timers are more accurate/relevant?
- Is there time spent that is unaccounted for?
- Timing facilities on PCs have resolution/accuracy limits and you will
have to run something for a long time in order to get any useful accuracy.
Time measurement accuracy is limited by tools of
observation and hardware/OS limitations. Another problem with measurement
is that external evironmental considerations (load average, user activity)
change results to some extent. The 2007 measurements were done long ago on
mars.cs.uidaho.edu, a sparc Solaris machine. The "who" command
reported 5 different
people logged in at the time, although the load average was apparently low
(inactive terminal sessions). The 2019 Threadripper numbers were for the
machine in my office running Fedora. Lots of processes, only 1 user.
lecture 15
No Class on Monday
Monday is President's Day.
Mailbag
- How do I draw arrowheads?
- The arrow is to be drawn from the last point
to the point given with the "e,x,y" at the beginning of the pos
attribute. Possible implementations:
- no arrow head, just a line from one to the other
- compute midpoint, draw a circle there
- calculate points on each side of the last point on the line segment
orthogonal to the last line segment, form triangle between them and
the point listed in the "e,x,y"
- Draw using decreasing line widths along the final line segment
- ... what did you-all end up doing?
Upcoming Conferences
Some of you should consider doing a semester project worthy of a research
paper. Some of you might even want to target one of these venues.
- WSCG 2019, papers due March 10, conference in Pilsen Cz 5/27-31
- CGI 2019, papers due March 25, conference in Calgary 6/17-20, (notification Apr 21)
- VISSOFT 2019, papers due Apr 26, conference in Cleveland 9/30-10/1. (notification May 26)
A Brief on Windows Unicon
- I did some debugging recently, related to spaces in pathnames, and
unbreaking an event monitoring bug that was Windows-specific.
- I have put up a .zip with my current .exe's and libraries at
http://www2.cs.uidaho.edu/~jeffery/unicon.zip.
It might or might not be usable, or less broken, than the public
Windows Unicon at the moment.
- I will work testing it, and on a proper Windows installer
at my earliest convenience
- I expect to put out some more improvements, related to drawing
text in the 3D facilities, in time for you to use them in homeworks
Timing, Part 2
- Last time we saw that the timing under a monitor that isn't asking for
any events costs very little.
- I think the times I reported were on cs-445 instead of the threadripper
in my office. Mea culpa. Threadripper is about 4x faster.
- Now let's look at how much it costs to monitor every single location
change, a very frequent event. Check out
timerloc.icn
- Remember: every event report, you are doing a context switch
to a different program, and back! This timer is mostly measuring that
context switch time.
time ../tools/timerloc ./scramble < scramble.dat > /dev/null
tp time: 366 - -6 = 372ms
em time: 394 - 6 = 388ms
0.490u 0.881s 0:01.46 93.8%	0+0k 0+0io 2pf+0w
Wow! Is that a factor of 100x? BTW, a pthreads context switch, where the
OS gets involved because you want to support true multicore or whatever,
costs maybe easily another 100x.
- You don't want
E_Loc events unless you really want them.
- We will see for other types of events, different costs
proportional to event frequency
- The most frequent event of all is probably
E_Opcode,
E_Loc pales in comparison.
- The high cost of event reports is an open area of research.
To work on it we'd go inside the VM runtime system (C code; outside
the scope of this class).
- Suppose you only want E_Loc for certain locations (e.g. breakpoints),
or E_Opcode only for certain instructions?
- Besides event masks, there are also value masks.
- installable, one per event code, thusfar rarely used
Now, I wonder how much evaltree costs? A past student once claimed it was
"slow". I wonder why that would be...
- procedure activity events are frequent.
- Not as frequent as line number changes...but then again
there can be several/many calls on a line of code...
- far more so if you ask for built-ins as well as user-level
- each procedure activity event report costs two co-expression switches
- evaltree itself uses time building and maintaining the tree
- the evaltree callback procedures (monitor application code) uses time
It would be useful to know whether the co-expression switch totally
dominates the time spent in the monitor. Although our intuition says
it does, intuition is not always correct. Evaltree costs: a big case
statement (not very efficient in Icon/Unicon), whose labels are generators
(not very efficient), whose code bodies do allocations and list operations
(pretty darned fast), and call the monitor callback procedure. One way
to do our experiment is to measure &time before and after each EvGet(),
and instead of measuring time spent in the target program, measure the
the other time, time spent in the monitor. Another way to do the experiment
is to rewrite the evaltree() functionality for speed instead of clarity, and
see if it is measurably different or not.
Compare evaltime.icn,
evaltime2.icn,
evaltime3.icn, showing an
attempt to do this experiment.
time evaltime ./scramble <scramble.dat
shows
| Sun Sparc, ~9/2007 | Threadripper, 2/2019
|
|---|
tp time: 2760--10=2770
em time: 6670-0=6670
10.0u 0.0s 0:18 55% 0+0k 0+0io 0pf+0w
|
tp time: 56--7=63
em time: 207-7=200
0.212u 0.094s 0:00.30 100.0%    0+0k 0+0io 0pf+0w
|
Using evaltree, the monitor is accounting for the vast majority of the
time, and the time reported for the target program is much slower than
for the unmonitored or empty monitored cases. evaltime2, which skips
the evaltree mechanism but uses a big case statement, gives:
| Sun Sparc, ~9/2007 | Threadripper, 2/2019
|
|---|
tp time: 2490-0=2490
em time: 2660-0=2660
5.0u 0.0s 0:08 61% 0+0k 0+0io 0pf+0w
|
tp time: 55--7=62
em time: 90-7=83
0.113u 0.085s 0:00.19 100.0%    0+0k 0+0io 0pf+0w
|
Cost of monitoring is substantially lower, although the particular
details may be affected by machine load fluctuation. One would have
to run several times and take averages for the numbers to be meaningful.
Using evaltime3, which avoids the large case statement, we get
| Sun Sparc, ~9/2007 | Threadripper, 2/2019
|
|---|
tp time: 2580-0=2580
em time: 2050-0=2050
5.0u 0.0s 0:07 70% 0+0k 0+0io 0pf+0w
|
tp time: 60--8=68
em time: 76-8=68
0.088u 0.103s 0:00.19 94.7%     0+0k 0+0io 0pf+0w
|
At this point, monitoring procedure activity is seen to impact
execution time substantially, but at least the monitor is taking
no more time than the target program.
Many Morals of the story:
- the UNIX
time(1) command is not very fine-grained
or precise.
- The monitoring of
&time gives times in milliseconds
which might or might not be reliable, they report what the C
millisec() function returns.
- The monitoring facilities attempt to explicitly separate the
&time reported by the TP from that of the EM.
My best guess is that this is imperfect, and TP is being charged
for part of the co-expression time.
- The coding of the EM has a (surprisingly?)
large impact on the practicality of the EM. Mastering
the language and coding elegantly actually matters for EM authors.
- Co-expression switch time may dominate but not totally dominate timings.
Griswold was fond of saying that on at least one old CPU where it was
measured, the co-expression switch cost less than a procedure call
in Icon. This is probably not true for us, but co-expression costs
are not the only factor in performance and not always the primary factor.
- The evaltree.icn module might be rewritable for
much better speed. It begs to have Hani's clever case tag applied to it,
and timings measured.
- Icon and Unicon VM compilers need a decent case expression optimization.
iconc might already do one, I am not sure.
scat
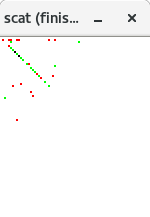
The scat program is a simple application of evaltree. You kind of have
to see this one running to appreciate it, so let's try and demo it.
It links in a scatterplot library which
might or might not be useful to you; scatlib implements the log scaling
that scat uses.
$include "evdefs.icn"
link evinit
link evaltree
link scatlib
Scat uses several global variables, three tables to remember what
has been plotted, and three clones set with different colors.
global	at,   # table: sets of procedures at various locations
	call, # table: call counts
	rslt, # table: result counts
        red,
        green,
        black
Scat uses a generic evaltree-compatible record type for modeling;
no extra payload added.
record activation (node, parent, children)
The initialization is straightforward.
procedure main(av)
   local mask, current_proc, L, max, i, k, child, e

   EvInit(av) | stop("can't monitor")

   scat_init()
   red := Clone(&window, "fg=red")
   green := Clone(&window, "fg=green")
   black := Clone(&window, "fg=black")

   current_proc := activation(,activation(,,,,[]),[])
Control is handed over to evaltree, which calls scat_callback
with events
   evaltree(ProcMask ++ FncMask ++ E_MXevent,
	    scat_callback, activation)

   WAttrib("label=scat (finished)")
   EvTerm(&window)
end
scat_callback mostly calls scat_plot, which calls colorfor to decide
what color to plot with.
procedure scat_callback(new, old)
   case &eventcode of {
      E_Pcall:
	 scat_plot(new.node, 1, 0, , colorfor)
      E_Psusp | E_Pret:
	 scat_plot(old.node, 0, 1, , colorfor)
      E_Fcall:
	 scat_plot(new.node, 1, 0, , colorfor)
      E_Fsusp | E_Fret:
	 scat_plot(old.node, 0, 1, , colorfor)
      E_MXevent: {
         case &eventvalue of {
	    "q" | "\033": stop("terminated")
	    &lpress : {
	       repeat {
	          scat_click(proced_name)
		  if Event() === &lrelease then
		     break
		  }
	       }
	    }
	 }
      }
end
Procedure proced_name returns the name of a procedure, taken from its image.
procedure proced_name(p)
   return image(p) ? {
      [ =("procedure "|"function "), tab(0) ]
      }
  stop(image(p), " is not a procedure")
end
Procedure colorofone distinguishes procedures from functions.
procedure colorofone(p)
  return if match("procedure ", image(p))
	 then red else green
end
Procedure colorfor uses a list (of procedures/functions) to select
what color to plot. If it is not the first color choice and the
subsequent value should be a different color, resort to black.
Return a red or green if all values say to be red or all say to be green.
procedure colorfor(L)
   if *L = 0 then return &window
   every x := !L do {
      if not (/c := colorofone(x)) then
	 if colorofone(x) ~=== c then
	    return black
      }
   return c
end
What is scat good for?
scat is cooler than you think. It shows not just who the hot procedures
are, it also shows what procedures always fail, what procedures generate
lots of results per call, and what procedures (predicates) generate
between 0 and 1 result per call.
lecture 16
Office Hours Pushback
My office hours today will start at 3pm due to my boss requesting the
half hour from 2:30-3.
More Class Cancellations
I am going to ACM SIGCSE in Minneapolis February 26-March 3. We will miss a
Wednesday and a Friday class that week, sorry! I will be reachable by e-mail
and will try to accommodate office appointment requests via Zoom.
HW#3 Discussion
- As a reminder, if you did HW#1 for C, you get to re-tool a bit
for HW#3 and beyond, as we will be monitoring Unicon programs. If any
of you are interested in working on building/updating my monitoring
framework for C/C++ or Java after the semester, please come visit.
- I tweaked one of your HW#1 solutions a bit and ran it on all the
suspects, so you should have no shortage
of json files to play with. Try out your HW#3 on all of them, and
look for interesting images/animations.
- I recommend you do as much HW#3 between now and Monday as possible,
so that if you need to consult me in person, you can do it before
Minneapolis.
algae
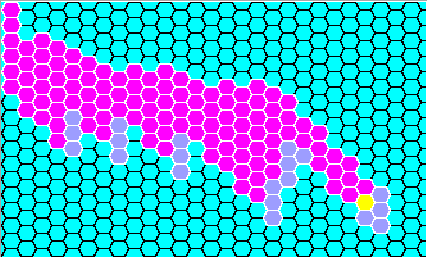
The flagship demonstration of the evaltree framework is a fairly literal
visualization of the activation tree.
   EvInit(av) | stop("Can't EvInit ",av[1])
   codes := algae_init(algaeoptions)
   evaltree(codes, algae_callback, algae_activation)
   WAttrib("windowlabel=Algae: finished")
   EvTerm(&window)
Algae takes command line options to say how much to monitor, how to
graphically depict the tree, etc. It deliberately chooses a simple-minded
incremental graphic, coming from a time that graphic performance was deemed
to be a likely monitor bottleneck. By default it uses hexagons for
activation records (compare hexagons with a square grid). A real but still
INCREMENTAL tree layout algorithm would be better.
procedure algae_init(algaeoptions)
   local t, position, geo, codes, i, cb, coord, e, s, x, y, m, row, column
   t := options(algaeoptions,
	   winoptions() || "P:-S+-geo:-square!-func!-scan!-op!-noproc!-step!")
   /t["L"] := "Algae"
   /t["B"] := "cyan"
   scale := \t["S"] | 12
   delete(t, "S")
   if \t["square"] then {
      spot := square_spot
      mouse := square_mouse
      }
   else {
      scale /:= 4
      spot := hex_spot
      mouse := hex_mouse
      }
   codes := cset(E_MXevent)
   if /t["noproc"] then codes ++:= ProcMask
   if \t["scan"]   then codes ++:= ScanMask
   if \t["func"]   then codes ++:= FncMask
   if \t["op"]     then codes ++:= OperMask
   if \t["step"]   then step := 1
   hotspots := table()
   &window := Visualization := optwindow(t) | stop("no window")
   numrows := (WHeight() / (scale * 4))
   numcols := (WWidth() / (scale * 4))
   wHexOutline := Color("white") # used by the hexagon library
   if /t["square"] then starthex(Color("black"))
   return codes
end
The real work happens in algae_callback()
procedure algae_callback(new, old)
   local coord, e
   initial {
      old.row := old.parent.row := 0; old.column := old.parent.column := 1
      }
   case &eventcode of {
      !CallCodes: {
	 new.column := (old.children[-2].column + 1 | computeCol(old)) | stop("eh?")
	 new.row := old.row + 1
	 new.color := Color(&eventcode)
	 spot(\old.color, old.row, old.column)
	 }
      !ReturnCodes |
      !FailCodes: spot(Color("light blue"), old.row, old.column)
      !SuspendCodes |
      !ResumeCodes: spot(old.color, old.row, old.column)
      !RemoveCodes: {
	 spot(Color("black"), old.row, old.column)
	 WFlush(Color("black"))
	 delay(100)
	 spot(Color("light blue"), old.row, old.column)
	 }
      E_MXevent: do1event(&eventvalue, new)
      }
   spot(Color("yellow"), new.row, new.column)
   coord := location(new.column, new.row)
   if \step | (\breadthbound <= new.column) | (\depthbound <= new.row) |
      \ hotspots[coord] then {
      step := &null
      WAttrib("windowlabel=Algae stopped: (s)tep (c)ont ( )clear ")
      while e := Event() do
	 if do1event(e, new) then break
      WAttrib("windowlabel=Algae")
      if \ hotspots[coord] then spot(Color("light blue"), new.row, new.column)
      }
end
Boring square graphics:
procedure square_spot(w, row, column)
   FillRectangle(w, (column - 1) * scale, (row - 1) * scale, scale, scale)
end

# encode a location value (base 1) for a given x and y pixel
procedure square_mouse(y, x)
   return location(x / scale + 1, y / scale + 1)
end
A whole new meaning for the term "graphical breakpoints":
#
# setspot() sets a breakpoint at (x,y) and marks it orange
#
procedure setspot(loc)
   hotspots[loc] := loc
   y := vertical(loc)
   x := horizontal(loc)
   spot(Color("orange"), y, x)
end

#
# clearspot() removes a "breakpoint" at (x,y)
#
procedure clearspot(spot)
   local s2, x2, y2
   hotspots[spot] := &null
   y := vertical(spot)
   x := horizontal(spot)
   every s2 := \!hotspots do {
      x2 := horizontal(s2)
      y2 := vertical(s2)
   }
   spot(Visualization, y, x)
end
User input handling:
#
# do1event() processes a single user input event.
#
procedure do1event(e, new)
   local m, xbound, ybound, row, column, x, y, s
   case e of {
      "q" |
      "\e": stop("Program execution terminated by user request")
      "s": { # execute a single step
	 step := 1
	 return
	 }
      "C": { # clear a single break point
	 clearspot(location(new.column, new.row))
	 return
	 }
      " ": { # space character: clear all break points
	 if \depthbound then {
	    every y := 1 to numcols do {
	       if not who_is_at(depthbound, y, new) then
		  spot(Visualization, depthbound, y)
	       }
	    }
	 if \breadthbound then {
	    every x := 1 to numrows do {
	       if not who_is_at(x, breadthbound, new) then
		  spot(Visualization, x, breadthbound)
	       }
	    }
	 every s := \!hotspots do {
	    x := horizontal(s)
	    y := vertical(s)
	    spot(Visualization, y, x)
	    }
	 hotspots := table()
	 depthbound := breadthbound := &null
	 return
	 }
      &mpress | &mdrag: { # middle button: set bound box break lines
	 if m := mouse(&y, &x) then {
	    row := vertical(m)
	    column := horizontal(m)
	    if \depthbound then {       # erase previous bounding box, if any
	       every spot(Visualization, depthbound, 1 to breadthbound)
	       every spot(Visualization, 1 to depthbound, breadthbound)
	       }
	    depthbound := row
	    breadthbound := column
	    #
	    # draw new bounding box
	    #
	    every x := 1 to breadthbound do {
	       if not who_is_at(depthbound, x, new) then
		  spot(Color("orange"), depthbound, x)
	       }
	    every y := 1 to depthbound - 1 do {
	       if not who_is_at(y, breadthbound, new) then
		  spot(Color("orange"), y, breadthbound)
	       }
	    }
	 }
      &lpress | &ldrag: { # left button: toggle single cell breakpoint
	 if m := mouse(&y, &x) then {
	    xbound := horizontal(m)
	    ybound := vertical(m)
	    if hotspots[m] === m then
	       clearspot(m)
	    else
	       setspot(m)
	    }
	 }
      &rpress | &rdrag: { # right button: report node at mouse loc.
	 if m := mouse(&y, &x) then {
	    column := horizontal(m)
	    row := vertical(m)
	    if p := who_is_at(row, column, new) then
	       WAttrib("windowlabel=Algae " || image(p.node))
	    }
	 }
      }
end
Calculating which activation a given click refers to:
#
# who_is_at() - find the activation tree node at a given (row, column) location
#
procedure who_is_at(row, col, node)
   while node.row > 1 & \node.parent do
      node := node.parent
   return sub_who(row, col, node)		# search children
end

#
# sub_who() - recursive search for the tree node at (row, column)
#
procedure sub_who(row, column, p)
   local k
   if p.column === column & p.row === row then return p
   else {
      every k := !p.children do
	 if q := sub_who(row, column, k) then return q
      }
end
A similar calculation for placing new nodes
#
# computeCol() - determine the correct column for a new child of a node.
#
procedure computeCol(parent)
   local col, x, node
   node := parent
   while \node.row > 1 do	# find root
      node := \node.parent
   if node === parent then return parent.column
   if col := subcompute(node, parent.row + 1) then {
      return max(col, parent.column)
      }
   else return parent.column
end

#
# subcompute() - recursive search for the leftmost tree node at depth row
#
procedure subcompute(node, row)
   # check this level for correct depth
   if \node.row = row then return node.column + 1
   # search children from right to left
   return subcompute(node.children[*node.children to 1 by -1], row)
end
How to use Clone()
#
# Color(s) - return a binding of &window with foreground color s;
#  allocate at most one binding per color.
#
procedure Color(s)
  static t, magenta
  initial {
     magenta := Clone(&window, "fg=magenta") | stop("no magenta")
     t := table()
     /t[E_Fcall] := Clone(&window, "fg=red") | stop("no red")
     /t[E_Ocall] := Clone(&window, "fg=chocolate") | stop("no chocolate")
     /t[E_Snew] :=  Clone(&window, "fg=purple") | stop("no purple")
     }
  if *s > 1 then
     / t[s] := Clone(&window, "fg=" || s) | stop("no ",image(s))
  else
     / t[s] := magenta
  return t[s]
end
Graphic Design(s) of the Day
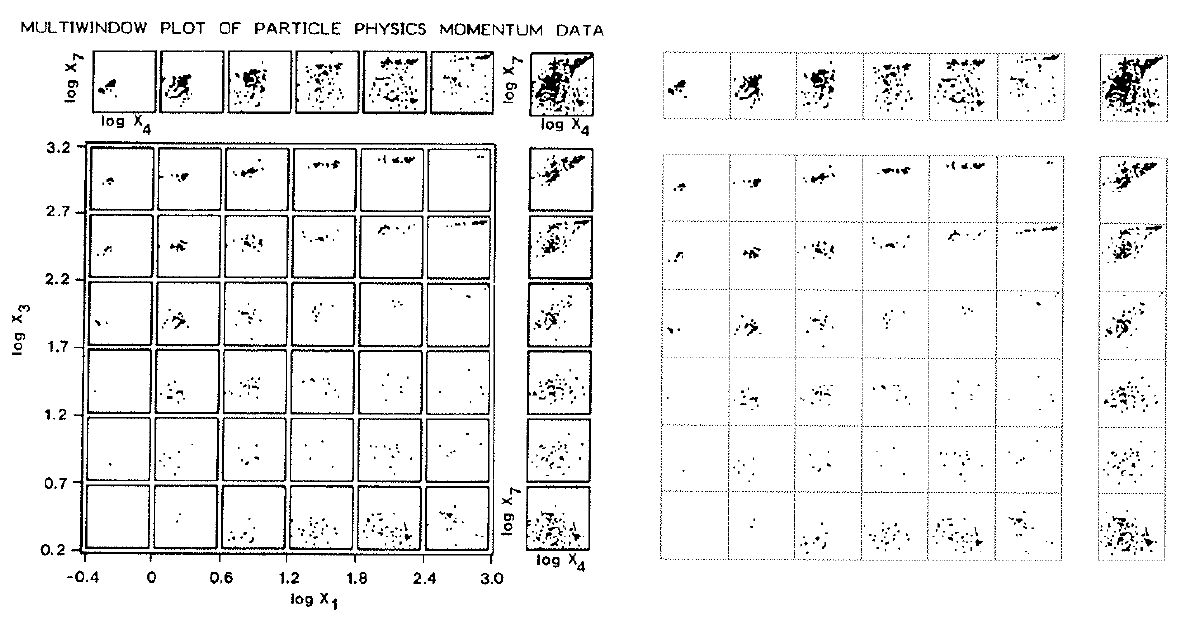 Consider the Tukeys' Multiwindow- and Box-Plots on the left,
and Tufte's Data-ink maximization on the right.
Consider the Tukeys' Multiwindow- and Box-Plots on the left,
and Tufte's Data-ink maximization on the right.
lecture 17
HW#2 Feedback
- vague HW spec? That is on Dr. J
- bugs in Unicon? That is on Dr. J
- Still, to give your program proper credit
I want to see it work on a variety of inputs.
- I tested with: hirose.json,
poem.json, and
typeinfer.json.
More broadly I might want to run it on any suspects/*.json
- Found a bug thanks to typeinfer.json: .dot format has reserved words that
we have to avoid! Like "node" for example. What all should we mangle
in translating .json to .dot format?
- Found a bug with open(cmd, "p"), when "dot.exe" was on the path in
a directory with spaces in its names, things did not go well. Fixed.
- I will accept one fixed/improved resubmit of HW#2 for
regrading purposes.
Windows Users' Notes
Reading
Discussion of "Overview of 3D Software Visualization"
- What was your favorite visualization idea from this paper?
- Define the three types of cognitive processes that visualization supports:
- Exploratory/Discovery
- Analytical/Decision-making
- Descriptive/Explanation
- What is the difference between scientific visualization and information
visualization?
- What are the main arguments as to whether to use 2D vs. 3D?
| 2D | 3D
|
|---|
| Pro | - fast
- low CPU
- cheap
- ubiquitous
- trained from infancy
| - density
- composition
- perception
- familiarity
|
|---|
| Con |
| - compute intensive
- hard to program
- hard to do 3DUI
- occlusion
|
|---|
- I dismiss "Augmented 2D" views out of hand. What about Adapted 2D views,
are they useful? What about combined 2D+3D presentations?
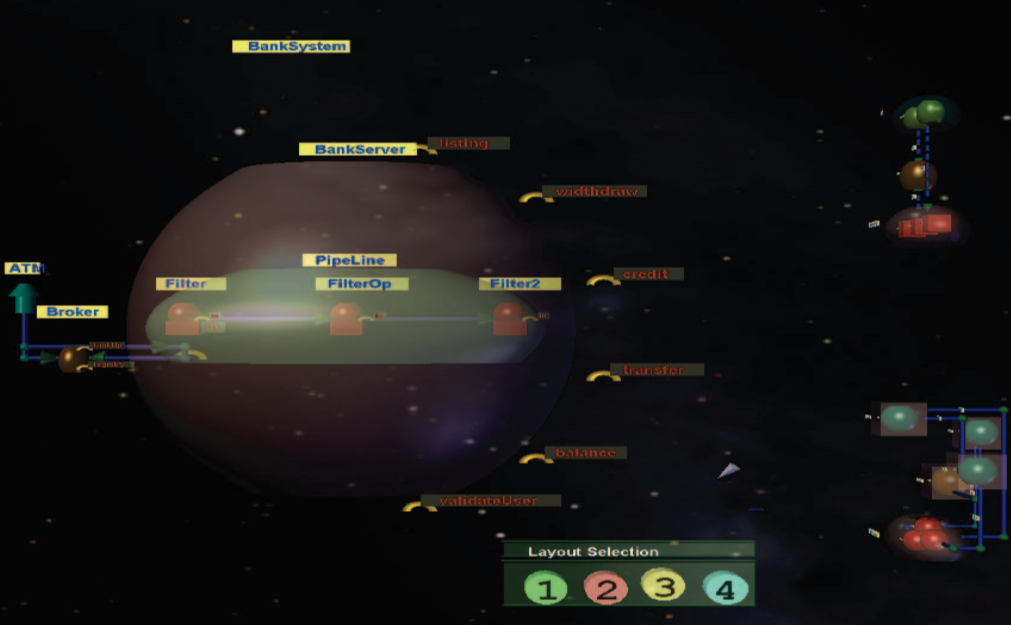
- Space metaphor: HUGE potential. See Figure 4.
- Which was your favorite 3D layout? Which ones pose questions?
- Which was your favorite 3D tree layout? Which ones pose questions?
- What did you think of the circular/spiral depictions of call stacks?
GUI Monitors
- Unicon has a GUI class library, written by Robert Parlett
- big, feature rich, inspired-by-Java
- GUI programming in Unicon has a learning
curve comparable to GUI programming in other languages.
- Homework #4 probably will include adding a GUI to your work
Step #1 in GUI exploration is usually to get familiar with the interface
builder program; in our case that is IVIB. (Demo of IVIB goes here).
IVIB generates code that looks like this.
- The 70-line application creates a dialog and calls
show_modal()
- For a normal GUI app you then fill in the method bodies for
whatever events you've requested.
- For most applications, it is not necessary to understand much of the
scaffolding and large classes you inherit behavior from.
- Unicon Technical Report UTR#6 teaches the IVIB basics.
IVIB let's you draw a GUI and generates the code for you. For a program
execution monitor the main question will be: how to merge the event streams,
or how to merge the event processing loops, from the GUI and from the
monitored program's events. To accomplish this, you need to know more about
the underlying GUI classes.
There are 3 classes that most Unicon GUI programmers
need to become semi-comfortable with:
- Component
- Component is superclass of all basic visible GUI elements in an
application: buttons, sliders, lists, editable text boxes, and so
on. Components are generally organized hierarchically -- they form a tree in
Venn diagram style, with larger background components containing smaller
more active components.
- Dialog
-
A Dialog is a component that constitutes the root of some window -- it owns
a window and therefor can receive input events, which it then needs to route
down the tree to the correct leaf.
- Dispatcher
- The Dispatcher class handles the actual
event-processing loop, allowing for multiple dialogs, and wall-clock time
events in addition to GUI events.
In order to merge the Monitor and GUI event streams, we might do one of
the following:
- keep the monitor event loop primary, and poll for GUI events (!)
- keep the GUI event loop primary, and peridically read monitor events (!)
There is no way to select() from between GUI and monitor or
poll both, because to ask for an EvGet() is to transfer control
to the target program (freezing the GUI of the monitor until an event
occurs). However, you can call EvGet() with an
E_Tick along with your other events if you want to be sure to
regain control periodically even if the other monitored events do not occur
for long periods... then your only danger is: what if the target program
that you are monitoring chooses to block on some input it wants to read?
Additional notes on GUI-monitors:
- "piano.icn" had been doing its own input event processing, with
E_MXevent at the top level monitor loop and nested loops
calling Event() whenever a "breakpoint" was in place.
- can't call
Event() cavalierly on your own in the middle
of your app -- or GUI won't respond any more. GUI owns input
processing, and calls you when a component gets an event.
- how does one "pause" or "single step" in a GUI environment? GUIs
are not allowed to freeze. You cannot call
EvGet(E_MXevent) to freeze
the program; while paused, do not call EvGet() at all.
lecture 18
Monitoring Memory Allocation and Garbage Collection
- Heap memory allocation is an important form of behavior that
we can monitor.
- Allocations in Icon/Unicon are "as cheap as possible",
but in many programs they play a major role in performance
- Sometimes code does lots of allocation by accident,
or does far more memory allocation than is needed for a problem.
- Garbage collection is usually pretty fast -- we don't usually go for
coffee when the GC message hits the console, like old Lispers -- but...
- if a program is garbage collecting continually (thrashing) it can
significantly impact performance. This would generally be because a
program is allocating excessively.
- How can we tell whether allocation is excessive, or
garbage collection seems too frequent?
Allocation and Collection Events
- one memory allocation event for each built-in type.
-
&eventcode gives the type of memory allocated
-
&eventvalue gives the number of bytes.
- Garbage collection is an E_Collect. IF in response to an E_Collect,
the next EvGet() includes a request for an E_EndCollect, it can also
request "reallocation" events: allocation events that list the
types and sizes of memory that was found to be live after the collection.
- It is fair to say that the heap situation is a little more complex now
than when these events were engineered: these events don't account for
multiple heaps, a.k.a. regions. Region events are a missing piece.
Mempie
See mempie.icn
More memory monitors: mini-memmon and nova
Check out mmm, nova
and oldnova. You should look at them as
unfinished prototypes.
Griswold's claim examined
Ralph Griswold liked to claim that co-expression activations were about the
same speed as procedure calls in Icon... and this matters a lot for
execution monitors based on co-expressions, so I re-examined this claim with
the following program:
procedure main()
   t1 := &time
   every i := 1 to 10000000 do p()
   write("10000000 calls: ", &time - t1)
   ce := create |1
   t2 := &time
   every i := 1 to 10000000 do @ce
   write("10000000 @: ", &time - t2)
end

procedure p()
   return 1
end
The results (on Linux x86_64) seem to suggest that co-expression activations
are quite cheap, only 25% slower than procedure calls
10000000 calls: 6210
10000000 @: 7920
Synchronous threads are a lot cheaper than true concurrent threads!
Playing with a mac implementation earlier this semester, I plugged in
a pthreads-based co-expression switch available from the current Icon
language implementation, and it was an order of magnitude slower...
lecture 19
Discussion of Last Week's Reading
Just as a reminder for this metaphor:
- building==function, texture/color=> LOC
- "city"==blue plate
- "pillar"==class definition
- "water tower" sphere==header file
- green "landscape" == directory
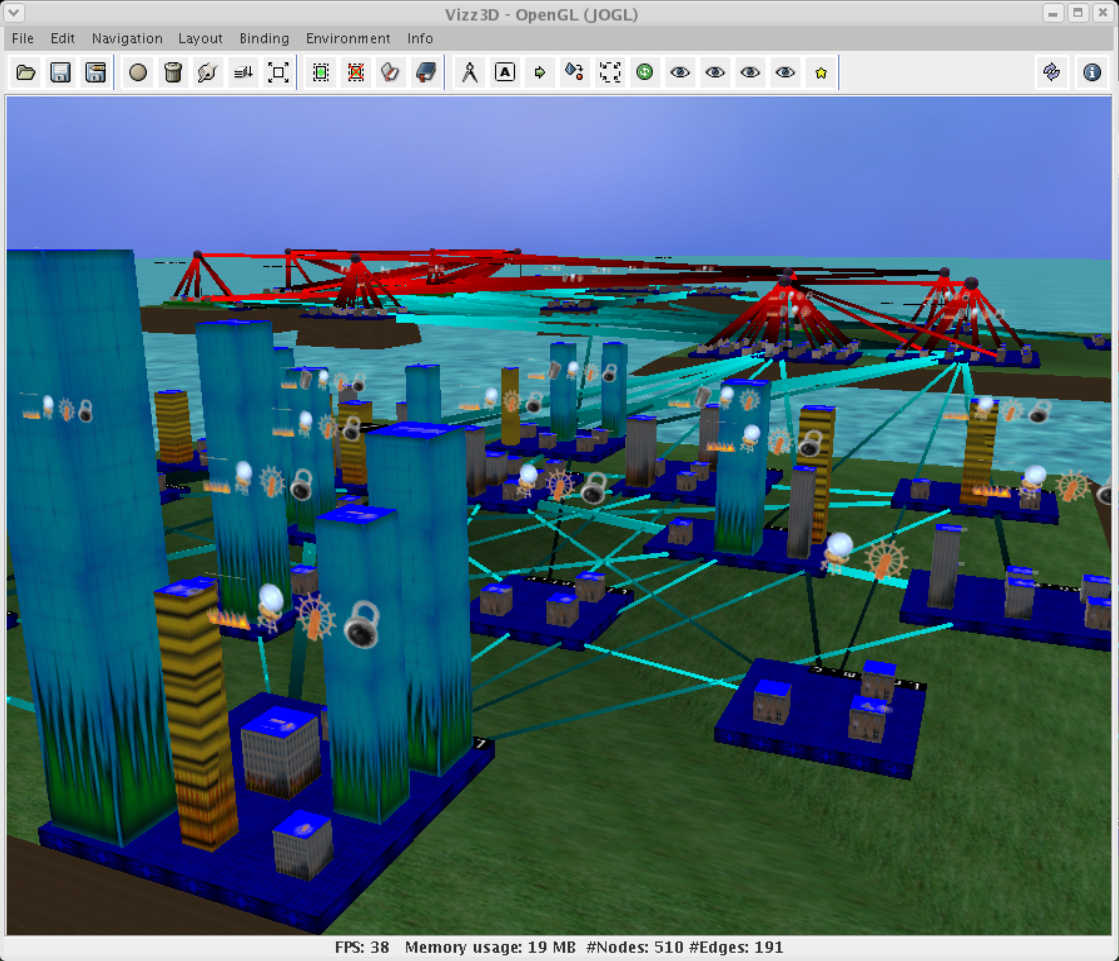
- big shots
- Tell me what you know about LLNL. They might need their visualizations
to work on the hardest real-world (very large, complex, C/C++)
programs
- "single view"
- their argument for the city metaphor is to visualize multiple aspects
about a program, for multiple stakeholders with differing roles and
concerns, so that they will all be able to see the same thing and
communicate effectively with each other over the shared artifact.
- "static and dynamic"
- they recognize the need for information based on program runs, not just
code. Dynamic info consists of whatever gprof will tell them.
Static info includes standard software engineering metrics:
lines of code, cyclomatic complexity, and various safety static analysis
checker outputs. They do not do, but anticipate the value of,
incorporating repository log information used in others' city metaphor
visualization research.
- "source level" vs. "middle level" vs. "architectural level"
-
- "source level" == fine grained; debuggers, profilers etc.
- "middle level" == problem-specific, tailored visualizations.
- "architectural level" == summarized, abstracted views of whole system
- multi-graph mindset
- function call graph sure, but instead of visualizing one big multi-purpose
graph they see it as a "union of graphs":
class call graph, class contents graph,
class inherits graph, file call graph, file contents graph, directory
contents graph...
- requirements
- support orientation and spatial memory
- multiple levels of detail
- different development stages; uniform, consistent representation
- robus against small changes
- integrate many different data
- scale to millions of lines of code
- Evo-Streets
- If you are going to do cities and maps, adopt techniques of cartographers
- Primary, secondary, and tertiary models
- Primary == original collected data. Secondary == all aspects of primary
that might ever be drawn together on a map. Tertiary == specific aspects
(selections, projections, coloring, symbols, legends...) for a single view
- Layout based on four things
- code hierarchy, elements' types and sizes,
(multiple types of) dependencies, and development time(stamps)
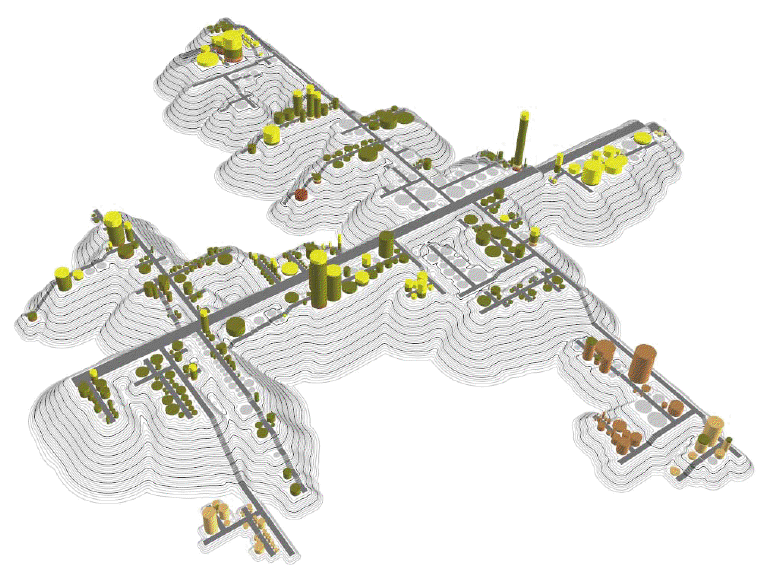
Reading Assignment
Monitoring String Scanning
Icon's string scanning control structure has a very natural depiction,
that of a progress bar or pointer working its way through a string.
Issues include: how to abstract/scale a very large number of operations,
how to depict backtracking, how to depict nested scanning environments
(which might or might not involve analysis of a substring of the enclosing
scanning environment).
Some programs use scanning a lot -- they are mostly string scanning -- and
others do not use it at all.
The ScanMask events are shown in the table below. E_Spos events are the
most frequent. Compared with procedure activity events, there appears to
maybe be one missing. Which one is it? Is it a problem?
| code | value | description
|
|---|
E_Snew | | create/enter a new scanning environment
|
E_Sfail | | fail/exit a scanning environment
|
E_Spos | | move the string scanning position
|
E_Ssusp | | suspend a result from a scanning environment
|
E_Sresum | | resume a suspended scanning environment
|
E_Srem | | remove a never-to-be-resumed scanning environment
|
May God bless richly the team that goes
For what its worth, evaltree()
can model scanning environments just like it
does procedure call activity. It can also model built-in functions and
operators; all expressions can be modelled as call/ret/susp/resum/fail/rem
Now for a deep-thought question: what kinds of graphic depiction emphasizing
what kinds of behavior would make for a genuinely useful string scanning
visualization?
Monitoring Structures and Variable References
The monitoring framework has fairly thorough instrumentation for
the built-in data structures of the language -- lists, tables,
records and sets. These one-level structures all support implicit
reference semantics, are routinely composed into big multi-level
structures such as trees and graphs.
lecture 20
What we learn from the simple list visualizer, lst.icn:
- basic events for list construction, shape changes, and accesses.
- lists are highly variable in size, frequency of access, and frequency
of structural change
- many lists are complex structures almost entirely unnoticed by a tool
that visualizes all lists as arrays.
- many or most lists are really just internal glue (non-root)
- many lists are uninteresting, there should probably be a threshold
beneath which no screen space is allocated (what should an empty list
look like?)
What we learn from the structure spy
- It is quite possible to infer structures from provided events
- Many programs will have 1-2 huge structures and dozens or hundreds
of small ones.
- Within a software city, where should structures live?
Design goals:
- enough 3D functionality to write games and virtual environments
- simplicity, ease of use -- reduce OpenGL 250+ functions down to ~30,
don't require the programmer to learn lots of new types
- consistency with Unicon and with Unicon's 2D facilities
3D Windows:
W := open("win","gl")
3D Coordinate System
- Not pixels
- real numbers using any units you choose
- x,y are traditional cartesian
- z is coming out of the screen at you
Camera and viewing Frustum
The scene is viewed from a particular (x,y,z) that is looking at a
particular (x2,y2,z2). There is also
a question of what direction is "up" from the point of view of the camera,
given as a vector but equivalent to specifying what angle the
camera is at on the vector between the position and direction.
Drawing Primitives
Originally I thought these would be defining things about the 3D facilities,
they are mostly built-in to opengl, although some are in the opengl utilities
(glu) library.
- cube
- point, line, line segment
- sphere, torus, cylinder, disk, partial disk
- polygon
Most 3D applications, once they acquire a certain level of sophistication,
probably don't need all these primitives, they just use FillPolygon with
lots of little triangles specified via large data structures called
3D models.
Transformations
- scaling, rotation, and translation are applied to all coordinates
on all drawing primitives via transformation matrices
- Unicon has
Translate(), Scale(), etc.
- historically opengl maintains matrix stacks to do these hierarchically.
- Actually two of them, one for the objects/data and one for the camera,
but just barely.
- Unicon has
PushMatrix(), PopMatrix(), etc.
- If used, these operations are so common that, e.g.
PushTranslate() is a combined PushMatrix() and Translate()
- once one goes to 3D models...the need for matrix stacks goes away
Lighting, Materials
- ambient, diffuse, specular
- Unicon has light0 ... light7 as graphics context attributes,
they are on or off, and if on, have each light type, plus a position
- objects can either be drawn with a material (which defines how it responds
to the different lighting types, plus have emissive light) OR a texture
(which by default won't respond to lighting at all) OR a blend of both.
This is an example of an area where things are far more complicated than
a non-specialist programmer would want to deal with. Unicon tries to have
sensible default behaviors.
Textures
Important, especially in more serious 3D such as games.
- texture
- 2D image whose contents are used to paint the pixels of a 3D primitive
- texture coordinates
- (u,v) in the texture image normalized to Cartesian 0.0-1.0. Actually,
they wrap around so a texture coordinate of 2.5 says to repeat a texture
two and a half times in that direction.
Unicon turns on texture mapping via WAttrib("texmode=on").
Texture coordinates are supplied via Texcoord(u1,v1,...) which must
correspond in 1:1 relationship to vertices in a subsequent primitive,
e.g. FillPolygon(x1,y1,z1, ...). There is also a WAttrib("texcoord=auto")
which might be needed in order e.g. to map textures onto spheres, tori, etc.
lecture 21
Try Again with Lst and Nova Demos
Miscellaneous Other 3D Facilities:
We might need to talk about various extra features in future lectures.
They are listed here so we can know to bring them up.
- blending texture and foreground/material property
- "buffered 3D mode"
- WSection
- JPEG textures, preliminary PNG support (on Linux)
- dynamic textures
- preliminary transparency support
- meshmode attribute for FillPolygon
- slices and rings attributes for changing the cost and precision of spheres and cylinders
- subwindows
- freetype fonts (needs further test-and-port work)
- tr := Texture(); ...; Texture(tr) to re-use a texture
Mesh modes
These values determine how lists of vertices are interpreted by OpenGL.
There is an attribute meshmode, set via WAttrib(w, "meshmode=value") where
the legal values are
- points
- lines
- linestrip
- lineloop
- triangles
- trianglefan
- trianglestrip
- quads
- quadstrip
- polygon
However, in a trivial test,
the mesh modes did not work!
They probably did for the grad student who implemented them...
but without a working test/demo they remain undocumented/unfinished business.
Minimally, you might expect that I'll have to put out some fixed Unicon
sources and/or binaries for you before these will work. You are welcome
to try them and find out of things are better than I report.
Transparency
This feature of OpenGL determines to what extent light can go through
a substance, or to what extent objects behind it can be seen through it.
Color names, set via Fg(color) or WAttrib(w, "fg=value") can include a
diapheneity. The legal transparency adjectives are
- transparent
- subtransparent
- translucent
- subtranslucent
- opaque
This feature is implemented. In a trivial test
it appears to work. However, in testing it a seeming bug was identified
in the color attributes: when you set the fg= attribute with a simple
color it sets the diffuse value for that material property but apparently
does not reset or disable the other lighting colors (specular, ambient,
emission), which may give surprising results. Also:
it is not clear that transparency works correctly on all primitives yet; for
example, the last time I checked, either cubes or maybe filled polygons
looked not as transparent as they ought, because backfacing polygons weren't
transparent.
mKE/mKR: the Largest Publically Available Unicon Program
It has its own website. It is a knowledge representation engine with its own
knowledge representation language built-in.
It is something like 50K LOC. Let's study it.
lecture 22
Reading Assignment
- static aspects == properties of program code itself, rather than
a program's run-time execution behavior
- some static aspects can be extracted from binaries, but many are
about source code
- crudest source code visualizations might map each text char to one pixel;
color code with control structure or whatever. Although source code
is perhaps the finest level of granularity, these tools have been used
to help study and navigate within very large programs. Source code
visualizations have been integrated into IDE's, yes? Which IDE's?
- class internals visualizations seem to be an important
medium-granularity visualization whose goal is to convey the structure
of a whole class. Which methods call which other methods, which
methods access which class variables, and how much of this class is
dependent on which other (super)classes might all be vital information
that can be depicted. It is interesting to compare these visualizations
with the types of diagrams that software engineers develop when designing
the software in the first place: to what extent are these just
reverse engineering of software design information? My gut tells me
that this area is under-researched.
- architecture visualization describes coarse-grained depictions
of entire software systems. A lot of interesting visualizations have
been developed for this category.
- Solar System Metaphor: star == package, planet==class, etc.
- Do you visualize the classes, or the relationships between the classes?
lecture 23
Announcements
- No class next Wednesday, I am going to PNNL in Richland Washington
for a discussion of education/research
- The HW#4 due date is pushed back a couple days.
It is posted on bblearn.
- Graphics facilities trouble? I am in-process on looking at some
misbehaving 3D programs, using valgrind on Linux and DrMemory on
Windows. I welcome additional example programs where the graphics
crashes or surprises you.
Semester Project Topic Ideas
The perfect semester project would be a tool that...
- is actually potentially useful to someone
- is usable on any (Unicon) program; is useful on programs having some
common property X
- does some actual analysis of the events to extract higher level semantic
information
- is scalable; can be run on at least medium sized programs, and preferably
large ones
- depicts information in a way that is easily and rapidly interpreted
correctly by ordinary humans; contains legends or axes or metaphors
or a help system that enables users to understand what they are looking at
- Team projects are welcome. They should be more ambitious.
Where to get your ideas:
- I am still charging towards the theme of: using dynamic information
to populate/animate a 3D city (or other 3D space) that reflects the
static structure of a program. Projects that relate to, or contribute
a small step towards this goal, are especially welcome. However, you
can do whatever you think will be most interesting/useful.
- Previous homeowork assignments suggested many possible projects
that looked interesting but were too hard to attempt as a HW
- Your own intuitions about what ought to be possible to visualize
- Your readings of the research papers
Monitoring Variable References
Variable use is arguably one of the most important aspects of program
behavior, but it is easily overlooked.
- Some programs primarily use the stack (i.e. local variables)
- Others primarily use the heap (especially, e.g. OOP programs)
- Historically many programs use primarily static / global data,
particularly real-time, embedded and other performance-focused
systems.
What do we want to know about variables?
- What proportion of data is static/global, stack, or heap?
How can these be measured?
- What data type variables hold; whether they ever change type
- Actual Scope: From where-all are variables read? From where-all
are they assigned?
- Lifetime: for any variable, is it short-lived, medium, or long-lived?
(Can you define what is a short- or long-lived variable?)
- Frequency: for any variable, is it heavily referenced? Are its
references in bunches, or relatively distributed across execution?
- Dependence: are some variables aliases for data held under other,
primary names?
Are they pointers into the middle of a larger structure, e.g. for
traversal?
Unicon Variable Events
We can start with E_Assign and E_Value, the
two events associated with assignment operators such as :=
E_Assign
- This event's &eventvalue gives the variable name, plus a one-letter
suffix indicating scope:
| Code | Scope
|
| + | global
|
| : | static
|
| - | local
|
| ^ | parameter
|
E_Value
- This event, after the assignment, tells you the value that was assigned.
Gnames shows you all your global data; variable names are written out,
color coded by their type. If you click on a variable name, up pops a
window showing that variable's details. Bugs and limitations:
- gnames should continue to support interaction after a program terminates,
so you can view variable state posthumously.
- gnames should (maybe) issue a breakpoint if a non-null variable
changes type.
- gnames should (maybe) highlight variable assignment and dereferencing,
for example flashing black (or white) for a brief time
vars is a local variable visualizer, it shows each activation record in a
manner similar to gnames. There is a strong scalability limit here which
vars does not solve; some programs it depicts well, others it does not.
It is more proof of concept/demonstration than finished and working tool.
Also, at present it has bad bitrot.
assignments to structure types
Consider the following program
procedure main()
  L := list(3)
  L[2] := "hello"
end
What does assigning to L[2] look like? The events program
shows the E_Assign for a structure reference does not look the same as
an assignment to the variable itself:
E_Ocall       operator call                      function []
E_Deref       dereference                        L-main
E_Lref        list reference                     list_1(3)
E_Lsub        list subscript                     2
E_Oret        operator return                    &null
E_Opcode      virtual-machine instruction        Str
E_Literal     literal reference                  hello
E_Loc         location change                    3:8
E_Opcode      virtual-machine instruction        Asgn
E_Ocall       operator call                      function :=
E_Assign      assignment                         list_1[2]
E_Value       value assigned                     hello
E_Oret        operator return                    hello
Under the Covers of the evinit library
EvInit(av) and EvGet(mask) are not always
entirely what they seem.
- They live in evinit.icn
- They can allow multiple monitors to share the observation of a
program execution, which we will discuss in detail.
-
EvInit() checks if the monitor's &eventsource
is already initialized (by a parent monitor who could pre-assign the
value of &eventsource)
- if so, it does not load anything, it just requests events from its
&eventsource
We might want to develop a similar architecture for windows.
Monitors that use 2D or 3D graphics might want to check and see
if their &window is already set. If so, just draw to it
instead of opening a new window. This would allow a GUI for a
debugger or multi-visualization tool to allow independently-compiled
visualizations to "plug in". Of course, for it to work well, such
a model would need to cover how to handle window resizing, and how
to handle input by various tools. Subwindows, and subwindow resizing,
are more or less adequate to this task.
lecture 24
- has a $1k prize
- has a data visualization category
- has a due date of April 16th
- "effectiveness, creativity, relevance to the state of Idaho"
On Improving the performance of Unicon 3D
- opengl performance depends violently on (a)hardware and (b)drivers
- if your Unicon 3d program is too slow, what do you do? Options include
- draw fewer triangles
- use fewer or smaller textures
- on integrated graphics the above constraints are pretty serious
- don't do lots of bytecode interpretation at runtime, setup the scene
and then let the C code just Refresh() or Eye() each frame
- it is sometimes possible to just use better hardware, or get better
drivers and achieve goals without making your software so clever
Your program could be CPU bound. Or it could be GPU bound. Or it could be
I/O bound e.g. on network traffic. Or in our case, it could be "TP bound",
i.e. spending most of its time in the target program and/or monitoring context
switch costs. Optimizing the wrong thing might not help much.
Unicon 3D Display List Management
- OpenGL has an internal concept of a display list that is more or less
a way to record a sequence of OpenGL calls in a data structure and repeat
them with high performance.
- Unicon's display list is not an OpenGL display list, it is a Unicon list
- Unicon's display list is discussed in UTR9 section 3.7 and the
corresponding place in the Unicon book.
- Unicon's display list records an entry for each state-changing
operation on a 3d canvas.
- As a Unicon list, it is fully manipulable by the application program.
- The display list contains a mixture of (sub)list and record entries,
mostly lists for variable-length things and records for things with a
fixed set of fields.
- For drawing primitives, the function generally returns the display list
entry. For other functions (e.g. that return a string result) you can
get the display list entry by asking for
WindowContents()[-1]
Cheesey (incomplete and buggy) UTR9 example:
sphere := DrawSphere(w, x, y, z, r)
increment := 0.2
every i := 1 to 100 do {
   every j := 1 to 100 do {
      sphere.y +:= increment
      Refresh(w)
      }
   }
What would this look like if it were changing the color of a sphere, instead
of changing its y coordinate? Setting the foreground color generates a display
list entry that is itself a list. For a simple foreground color setting
(one that only sets the diffuse property) it is a list of 7 elements*: the
string "Fg", the integer code 160 that correponds to a fgcolor setting,
the string "diffuse" that indicates what color property is being set,
and then four 16-bit unsigned values that give the RGBA color setting.
*The current color-setting display list entry format might get turned
into a record type so we can use field names instead of L[4] etc. but
for now it is a list.
The following example gives a sphere that bounces and changes its colors
randomly between red, white, and blue each frame:
procedure main()
   &window := open("win","gl","size=800,800","bg=black")
   colors := [[65535,0,0],[65535,65535,65535],[0,0,65535]]
   Fg("blue")
   spherecolor := WindowContents()[-1] # fg=most recent display list entry

   sphere := DrawSphere(0, 0, -50, 2)
   increment := 0.2
   every i := 1 to 100 do {
      every j := 1 to 100 do {
         sphere.y +:= increment
         c := ?colors
         spherecolor[4] := c[1]
         spherecolor[5] := c[2]
         spherecolor[6] := c[3]
         Refresh()
         }
      increment *:= -1
      }
   Event()
end
On Drawing Text on 3D Windows
- It is bluntly embarrassing to me that text in 3D is even an issue
- OpenGL doesn't provide a built-in text rendering capability
- Brute Force Version 1 (e-mail last weekend) used a cube instead of
just a rectangle. Pro: potentially readable from all sides. Con:
doesn't scale super-well. 6x slowdown? How much trigonometry would
it take to rotate the text so it always faced the camera?
- HUD vs. in-world text labels: text rendered as a texture is generally
going to be fuzzy (big problem on e.g. Oculus Rift) and/or pixelated.
Might want to calculate size/position and then render in 2D, if your
API supports that.
- Lots of games exhibit good solutions, but fewer open source libraries
that run on all major platforms than you might expect.
- Unicon's 3D
DrawString() depends on Freetype
(font rendering engine) and (on XWindows: Xft) and FTGL
(obscure C++ freetype-for-OpenGL library).
- Windows has been an ongoing portability problem for FTGL. Libraries
have been built for specific windows compiler versions but are never
just "there" for current Mingw gcc. FTGL and similar are
kind of hard to build, and semi-abandonware. FTGL was abandoned
by original developer on sourceforge, but picked up by someone else
now on github (last commit in 2018).
- Alternative libraries that I could try: GLText (last updated 2003),
QuesoGLC (last updated 2011). I don't know of one that would prove
easier to support consistently on Windows. Feel free to find me one.
- Or we could roll our own
Arbitrary DrawStrings from a Single Texture Load (duh)
- Instead of allocating a separate texture for each text label (bad)...
- Allocate one texture for an entire font
- Render each letter in a single "quad" (hardware will use 2 triangles)
- Figure out how to render only the fg pixels, bg as transparent
- Today we will get started
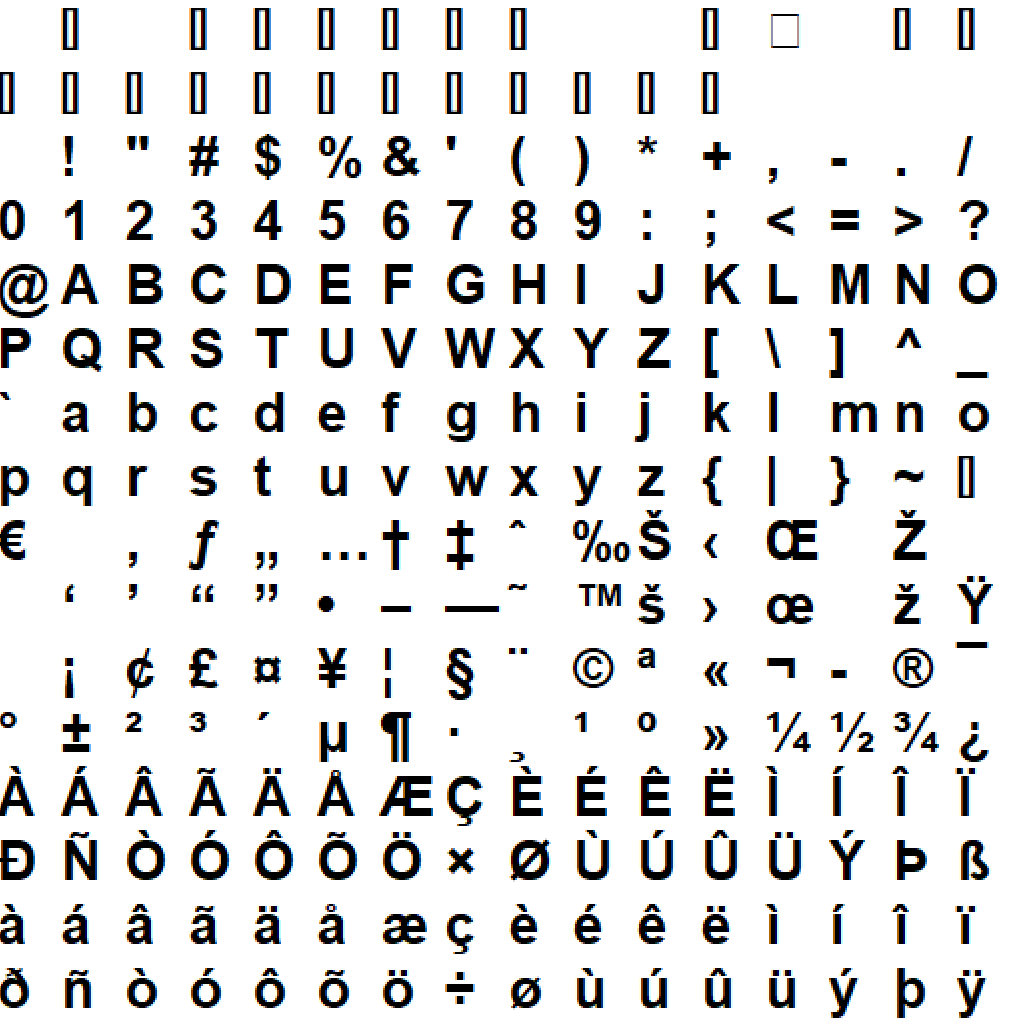
text.icn
lecture 25
Homework #4 Due Date Change
- The HW#4 Due Date is further extended to 4/1/11:59pm.
- I would like you to make your HW#4 a bit more polished than
previous homeworks. Make it as flexible/general/good as you can
manage by then. Try it on a lot of suspects. Report bugs.
- To maximize your points, you can demo it for minutes or so and
receive feedback, by volunteering, on either Friday or Monday in class.
Demoing is optional. Slots are first-come first-serve; you may request
a spot by e-mail in advance.
- If you show your tool, plan to ask and answer basic questions like:
how well does your tool scale to larger programs? How do you manage
to make labels legible? How do you insert delays or otherwise scale
time so that the animation/activity is legible?
Reading Assignment
One of these two is very short, while one is a regular full conference paper.
This was an extremely short paper you were assigned to read this past
week.
- objective: visualize concurrent behavior (dynamic, from traces)
- they talk about "simultaneously visualizing" static and
dynamic properties
- different city metaphor: each instance gets its own "storey"
-- not scalable.
- "streets" are lines drawn whenever instance A calls instance B.
-- utter annihilation of the city metaphor
- color coded threads, created as instances from a special "thread" building
in a separate neighbhorhood. Similar separate building for
semaphores, each semaphor is a storey.
- roof-top arrows depict static relations: black==inheritance,
gray==implements, white=="other"
Monitor Coordinators
Basic premise:
- Unicon's monitoring facilities are intended to reduce the
difficulty of writing monitors.
- Monitors are easier to write if they are
simpler and smaller, and look for specific behaviors.
- But, we want to be
able to monitor several aspects of behavior for a given execution, and
- potentially we want to look for interactions between behaviors.
A monitor coordinator is a monitor that hosts the execution of the
target program under the observation of multiple monitors.
Eve
The reference implementation monitor
coordinator is called Eve (eve.icn).
Eve is one of the last remaining "old Icon GUI" programs, and needs
to be rewritten using the modern GUI class library.
Eve configuration
Eve reads in a list of monitors from a ~/.eve file in the format:
"title" command line
For example:
"Line Number Monitor" /home/jeffery/tools/piano
"UFO" /home/jeffery/tools/ufo
"Algae" /home/jeffery/tools/algae
"Big Algae" /home/jeffery/tools/algae -func -op -step -S 48
"Memory bar chart" /home/jeffery/tools/barmem
"Global variables" /home/jeffery/tools/gnames
"Local Variables" /home/jeffery/tools/vars
"Lists" /home/jeffery/tools/tinylist
"Minimemmon" /home/jeffery/tools/mmm
"Miniloc" /home/jeffery/tools/miniloc
"Scat" /home/jeffery/tools/scat
"String scanner" /home/jeffery/tools/ss
From this datafile, eve draws an opening window that allows selection
of which monitors you want to run (selectEMs).
Eve's Global State
-
unioncset
- cset mask that is union of all monitor masks
-
EventCodeTable
- table of lists; keys are event codes, values are
"list of interested monitors"
Monitor State
This "class" holds eve's knowledge about the monitors it loads.
"prog" is the actual loaded program (a co-expression value), while "mask" is
the program's event mask -- what it returned from its last EvGet().
record client_rec(name, args, eveRow, prog, state, mask, enabled)
#
# client() - create and initialize a client_rec.
#
procedure client(args[])
local self
self := client_rec ! args
if /self.name then stop("empty client?")
self.prog := load(self.name, self.args) | stop("can't load ", image(self.name))
variable("&eventsource", self.prog) := ¤t | stop("no EventSource?")
variable("Monitored", self.prog) := &eventsource | stop("no Monitored?")
/self.state := "Running"
/self.mask := ''
/self.enabled := E_Enable
return self
end
Initialization
After selecting monitors to run, eve has to load them all, and then
activate them all, running them up until their first EvGet() call.
Their EvInit's will be disabled by eve's having already set their
&eventsource. After their first EvGet()
call, eve registers them on the "list of interested monitors" for each
of the event codes in their mask.
   every i := 1 to *clients do
      clients[i].mask := @ clients[i].prog
Event Forwarding
EvSend(code, value, recipient) - sends a monitoring framework
event, where code defaults to &eventcode and
value defaults to &eventvalue.
Note that EvSend() allows any value to be sent, not just what the EM requested
in its event mask, and not even limited to 1-letter string codes.
Eve's Main Loop
procedure mainLoop()
   while EvGet(unioncset) do {
      #
      # Call Eve's own handler for this event, if there is one.
      #
      (\ EveHandlers[&eventcode]) ()
      #
      # Forward the event to those EM's that want it.
      #
      every monitor := !EventCodeTable[&eventcode] do
	 if C := EvSend( , , monitor.prog) then {
	    if C ~=== monitor.mask then {
	       while type(C) ~== "cset" do {
		  if C === "abort" then fail
		  #
		  # The EM has raised a signal; pass it on, then
		  # return to the client to get his next event request.
		  #
		  broadcast(C, monitor)
		  if not (C := EvSend( , , monitor.prog)) then {
		     unschedule(monitor)
		     break next
		     }
		  }
	       if monitor.mask ~===:= C then
		  computeUnionMask()
	       }
	    }
	 else {
	    unschedule(monitor)
	    }
      delay(6 < delayval)
      }
end
lecture 26
Brainstorm with me on "3d Monitor Coordinators"
What would it take for us to see/share all your visualizations in the
same 3D window, from separate monitors? What would a 3D monitor coordinator
need to do?
Unicon City: a Brief Discussion
Want:
- ability to generate a 3D city from arbitrary software repository, such
as project(s) on Github or sourceforge
- static information via directory traversal of many source files, scaled
up a bit from your earlier homework
- highly dynamic information via monitoring facilities
- potential for semi-dynamic information of at least two types:
- revisions to code repository, slow code change over time
- multiple program executions, such as post-mortem traces/logfiles
- ideally, would work on many popular languages
- initially, Unicon (duh), plus:
- option #1: replicate monitoring facilities, etc.
Labor intensive, becomes "development" instead of research
- option #2: implement (subsets of) other languages in Unicon.
Very viable for education context, e.g. CS 120-121 subsets;
maybe not in other contexts
Some Code Prototypes:
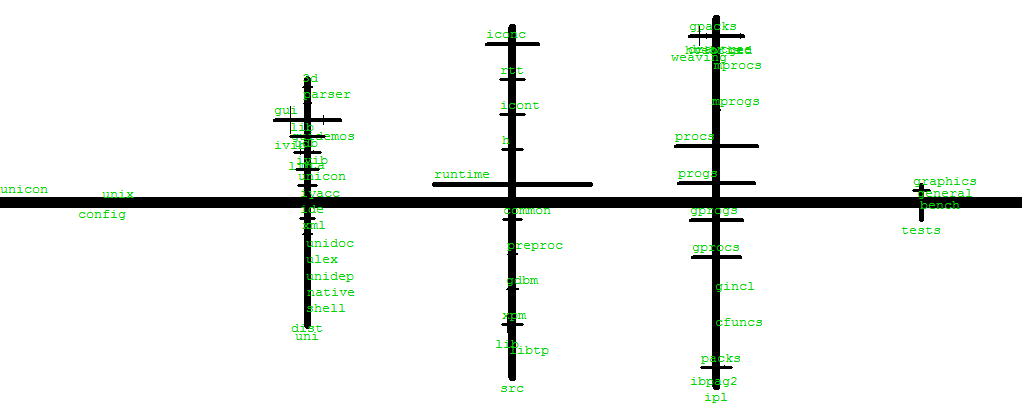
Layout in 3D
I haven't converted to 3D yet, so the following are open to your
suggestions and/or better ideas.
- create 1+ prototype "box" building textures
- layout 1+ "levels" for different languages used.
In Unicon, this is 2, or 3 (Unicon, C, and in the middle RTL).
- distribute files along streets
- distribute classes/functions within files.
- output in a 3D model file format. Initially, for example, CVE .dat
file format. This uses units of 1.0==1 meter. Sample file
# Unicon City Template Model

default {
  name Unicon City
  home [5.0, 0.0, 5.0]
  angle 4.6
  origin_node toplevel directory
}


Room {
name toplevel directory
x 0
y 0
z 0
w 10
h 10
l 10
texture wall.gif
}
Within the CVE format, there are a couple possible ways to introduce
the buildings
- in version 0, just place them as boxes within one gigantic "room"==world
(as long as users cannot walk into buildings)
- in version 1, place them as separately "rooms"
(allow users to enter buildings)
- in version 2, generate many internal "rooms" per building
Graphic Design of the Day: Kiviat Diagrams
One way to represent many-dimensioned data is to lay out the dimensions
around a circle; the 2D shape (and its degree of circularity or lack
thereof) tell you something about which dimensions are interesting.
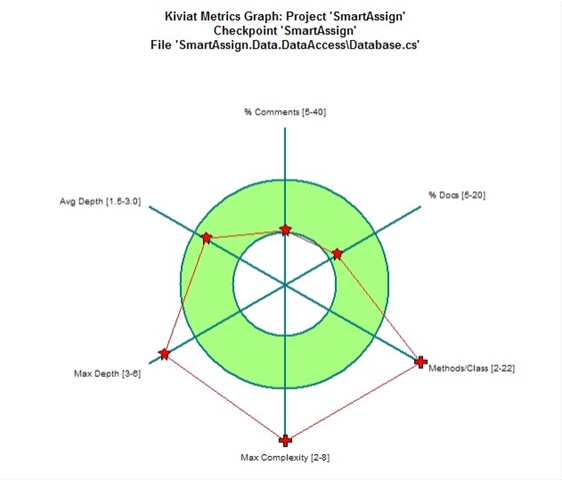
Kiviat diagram for software quality. Source: geeks with blogs, via google image
Kiviat diagrams are easy to criticize. There are problems with the relative
scales of dimension; do you reduce them all to 0.0-1.0 ranges, or not? There
are problems to identify normal or acceptable ranges of values. There are
problems that adjacent dimensions don't really have any more connection with
each other than remote dimensions, but the Kiviat makes them look like they
do. The area inside the Kiviat shape is really meaningless.
lecture 27
Reading Assignment
Discussion of VR City Papers
Search and Exporing Software Repositories in VR
- Set of (open source) code repositories == planetary system
- "world clouds", a play on "word clouds" try to connect semantics
search terms to class names
- Code structure details via a city view.
- Using HTC Vive despite the fuzziness of text in current-gen VR
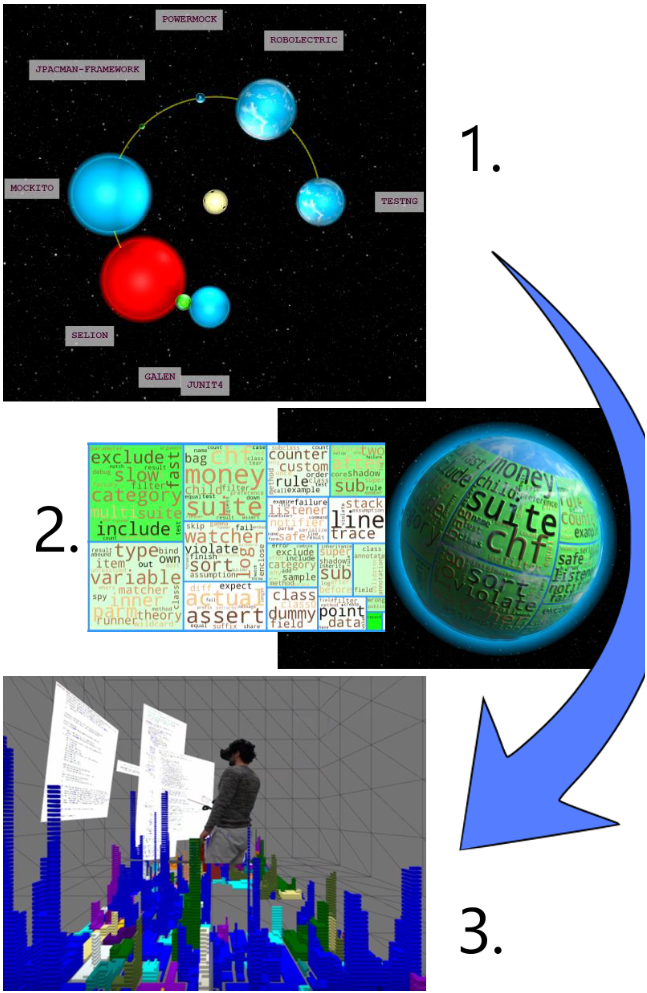
VR City
So, we have reached current state-of-the-art getting-published
software city research! How does it compare?
- slightly refined (how?) city metaphor as in Lanza et al
- Class == building, method==floor, assembled Minecraft-style
from little cubes corresponding to some changeable metric.
- Some fancy math (Hilbert curve! LOL), bringing a grenade
to a knife fight.
- Ability to color code buildings, connect an author's commits
or replay "trace" files containing method calls/returns
- HTC vive; all the fuzzy source code you can eat
- massively stuck in birds-eye view when city begs for First Person
- city is still uninhabited
- but at least it is prettier! and somewhat more detailed
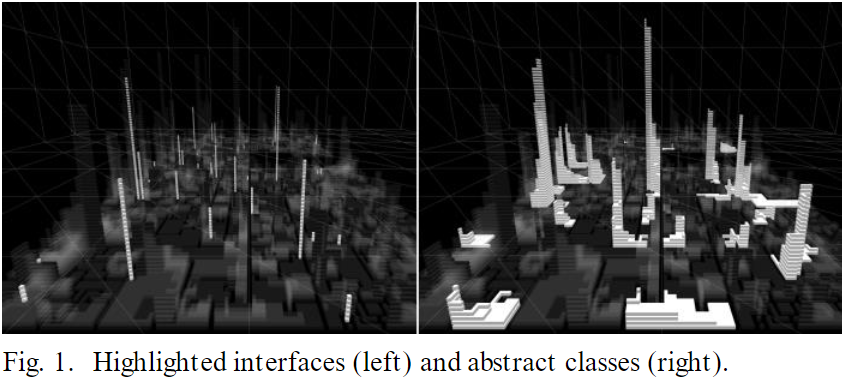
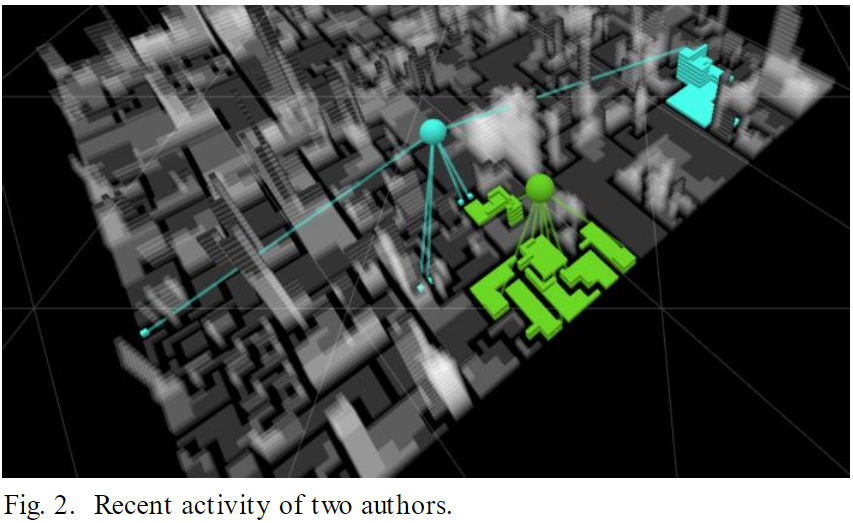
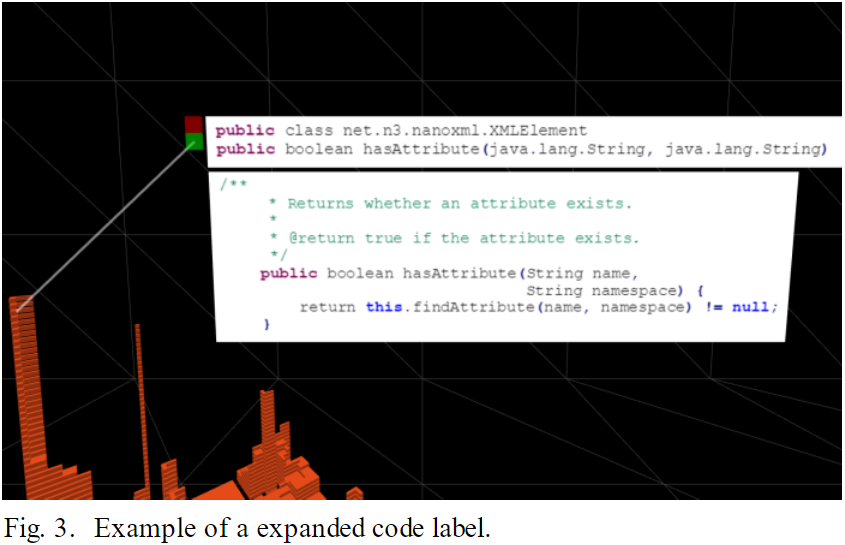
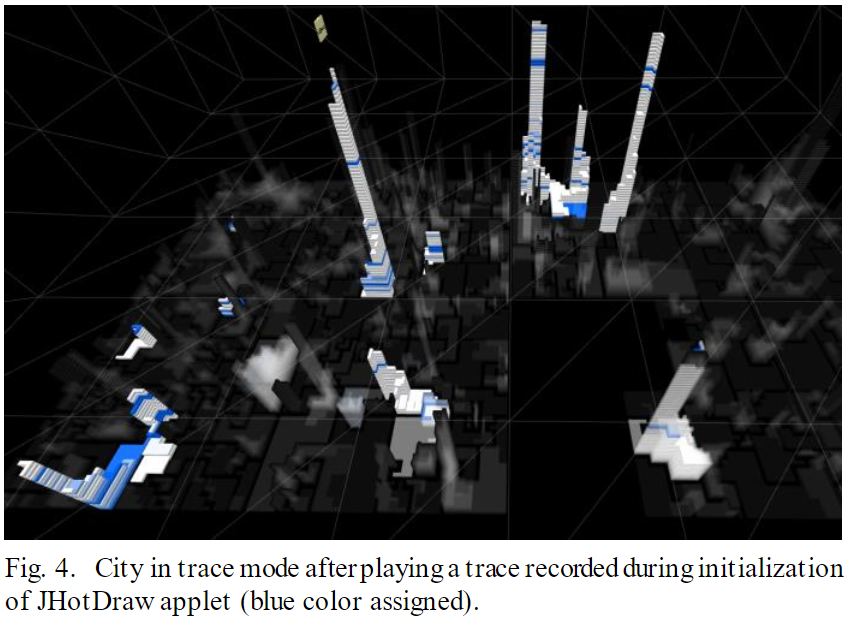
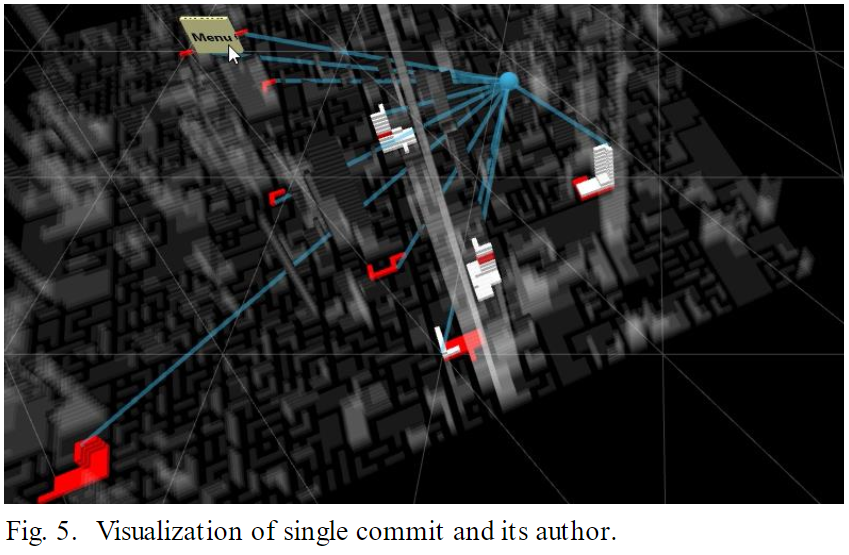
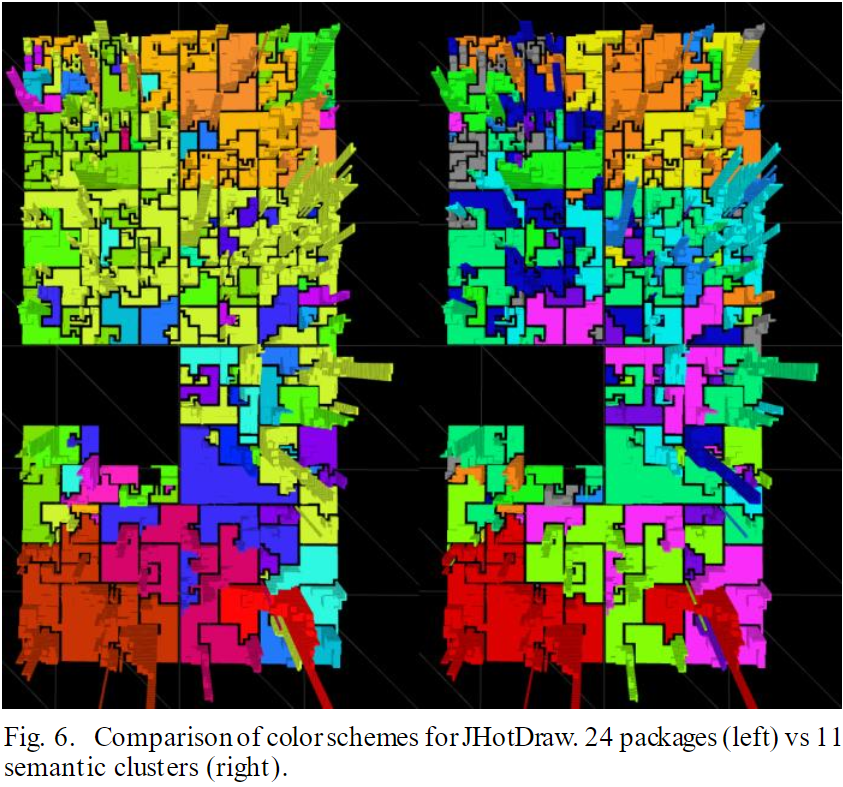
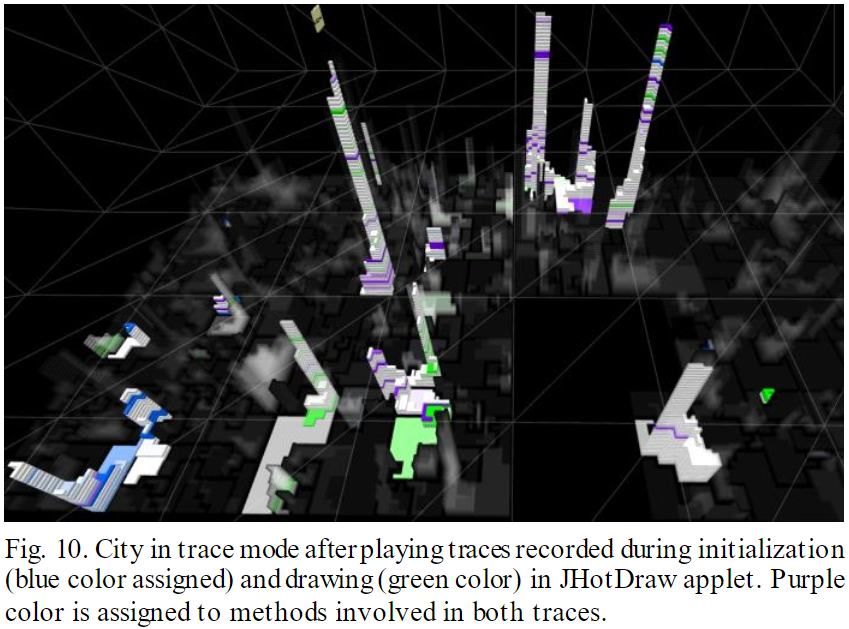
Update on Dr. J's Code Analyzer Tool
- Over the weekend, I combined the two previous prototypes
- cod3d.icn
reads the entire directory hierarchy and generates the 2D layout from
live data
- "streets" now have a collection of "file" objects which contain the
source code
- next steps:
- layout file objects in 2D
- populate "file" objects with
building objects corresponding to classes and functions
- generate a CVE .dat file of the buildings
(former CS 428 students, if your old Java program handles
.dat file format, you could potentially render the results)
- inject various computer controlled characters (dinosaurs, anyone?)
corresponding to different types of events
- map memory references into micro-forces directing NPC's to locations
in the code where they are referenced
Type Conversion Events
Unicon does more automatic type conversion than C/C++. At almost
every operator, and every built-in function, the types of arguments
are checked, and if necessary, converted.
| Event | Value | Description
|
|---|
E_Aconv | input value | attempt to convert
|
|---|
E_Tconv | example target | conversion target
|
|---|
E_Nconv | input value | no conversion was needed
|
|---|
E_Sconv | output value | conversion was successful
|
|---|
E_Fconv | input value | conversion failed
|
|---|
Tool of the day: redconv
Redundant conversion catcher. This is not a visualization tool, but it is an
execution monitor. Even if conversions are not redundant, they may be an
indicator of a bug or a performance problem. When is a conversion
"unhealthy"?
lecture 28
WSection, 3D Object Selection, and Level of Detail
3D graphics is computationally intense. Unicon's 3D Facilities are a
compromise between the dynamic language and the requirements of the
underlying 3D API's in C/C++.
History:
- Classic OpenGL C mindset: render entire scene in code each frame.
On a VM interpreted language that was a non-starter: too slow.
- Unicon mindset is: build scene on display list, let C code render
display list each frame as fast as it can.
- Worked well on single-room FPS-style tests
- On integrated graphics, we brought the machines to their knees
very quickly as we extended from a "single room" to a "building floor"
scale.
- On NVIDIA with decent drivers, we got a LOT farther, but the code still
dropped to unacceptable frame rates when we tried to do a whole floor
- In large environments: a TINY percent of your scene will be visible in
each frame. Start with the 50% that's behind you. But wait, how many
degrees of field of vision does your display do? And how about the 50%
that is behind larger objects, like walls for example?
If you OpenGL-render it all, you pay for all the invisible stuff.
- For Unicon, a crude metric turned out to be the display list size. Each
CPU/GPU is different, but somewhere between 10,000 - 50,000, the
runtime system C code just can't walk through it 60x/sec. For a
larger display list, we have to have a way to skip invisible stuff.
Options for better performance include:
- Buy faster hardware ($ works to some extent)
- Make the compiler/VM faster (if app is CPU bound)
- Tune the language runtime system OpenGL C code.
- Hardwire more in C. Use much fancier data structures/algorithms in C.
This is what a "game engine" would do.
- Write smarter Unicon code that asks the GPU to do less work per frame.
Except Unicon is slow, so CPU/frame is also very limited budget.
We settled on a Uniconish way to implement the concept level of detail
without rebuilding the display list each frame.
Level of Detail
Level of Detail in typical games:
- objects farther away are smaller, fewer pixels
- the full up-close OpenGL render would be a waste
- related concept: mipmapping. You can use smaller textures for farther
away objects.
WSection(): Basic Idea
- Add the ability to group, and turn on/off, sections of the
display list each frame without having to rebuild it
- Boolean flags inserted into the display list, include an extent
which says how far you can skip over when the section is disabled.
- Sections are named for human's sakes
- Start a section with WSection(name), end it with WSection()
- Sections may be nested hierarchically
- Sections are also used to group 3D primitives together for
3D object selection
WSection() Example #1
WSection("redrect") # beginning of a new object named redrect
Fg("red")
FillPolygon(0,0,0, 0,1,0, 1,1,0, 1,0,0)
WSection()          # end of the object redrect
WSection() in 3D Object Selection
- WAttrib("pick=on") turns on object selection. If it is on:
- After each event,
&pick generates strings that
identify each named (by WSection()) 3D object that the mouse is on.
- There is a library, selection3D, that encapsulates that in a more
GUI-class-library callback-method style. See UTR
Visualization Evaluation Questions
Specific questions to think about as you consider other folks' visualizations,
or design your semester project
- What data domain(s) is the described system able to observe?
- What analysis does the described system perform?
- What visualization or novel data presentation techniques are employed, if any?
You should at least hear of X3D in this class. Let's discuss it.
- First there was VRML, and it was a parody of HTML with a 1:1
correspondence to a popular SGI C++ 3D library used for early VR.
- Detailed graphics scenes depiction in a browser that had to have
a special plugin, hard to support all browsers, updates etc.
- Browser plugin has hardwired basic 3D UI (camera control etc) but not
a full featured general purpose applications programming interface.
- Then came X3D, it is an XML-based successor for VRML.
- WebGL or Web3D or HTML5 or whatever standards have managed to
mostly solve the 3D web portability problem
- Remaining issues: data formats don't solve the code/API generality
problem. Most web applications are interpreted and/or run real slow.
Site load times threaten to be "bad" on legacy broadband. Imagine
needing to download WoW on the fly every time you play.
Rube
This work is described in
"The rube Framework for Personalized 3D Software Visualization",
by Hopkins and Fishwick, Dagstuhl software visualization seminar, 2001.
- idea: users should develop their own (visual) metaphors.
- 3d, web-based
- Separate geometry from inter-object semantic relations
- Model Fusion Engine merges object geometry and dynamic behavior models
into a 3D scene (VRML scene file).
- generates X3D
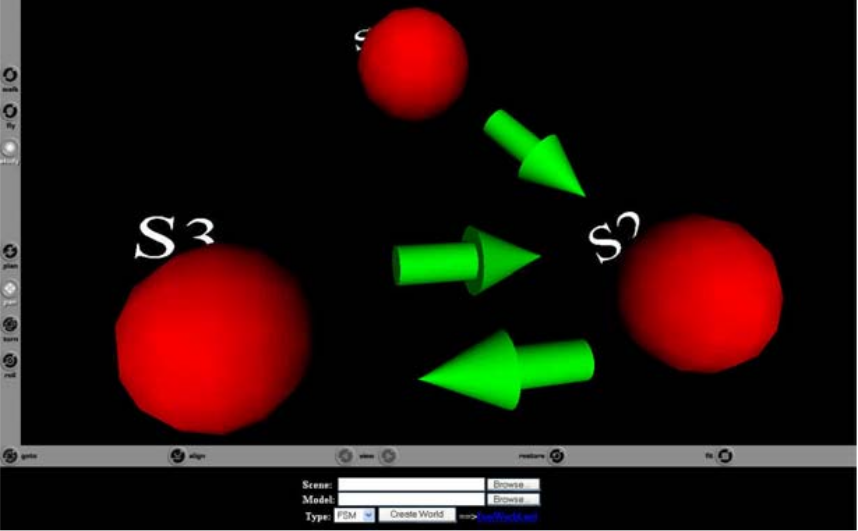
Rube methodology
- choose system to be modeled
- select structural and dynamic behavioral model types
- choose a metaphor
- define mappings/analogies
- create model
Example: a lightbulb is to be modeled. A finite state machine is chosen
to model the bulb. S1=disconnected, S2=off, S3=on.
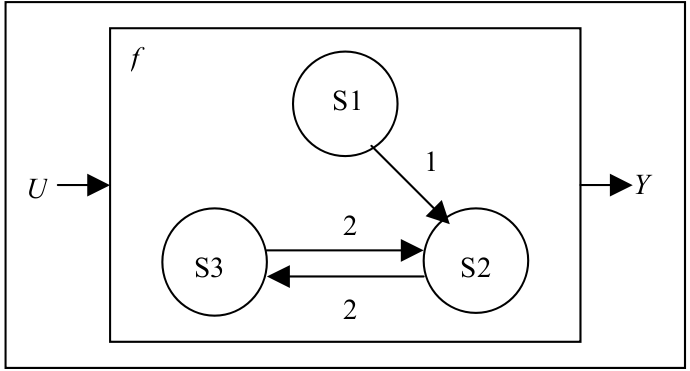
For each different dynamic model type, there may be any number of defined
visual metaphors, or a programmer may wish to create a new one. A "water
tank" metaphor for a finite state machine would "fill the tank" of whichever
state the machine is in, and the water would be pumped over to a different
tank whenever a transition to a new state occurs.
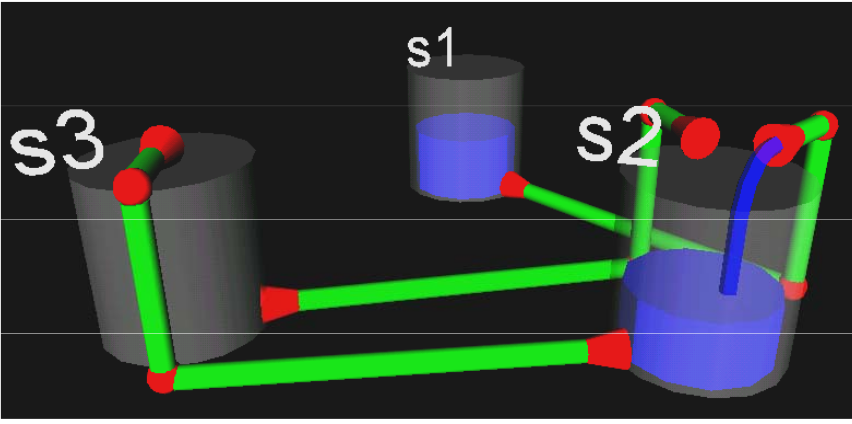 In a gazebo metaphor, a person would indicate the state, and a transition
would be depicted by that person walking.
In a gazebo metaphor, a person would indicate the state, and a transition
would be depicted by that person walking.
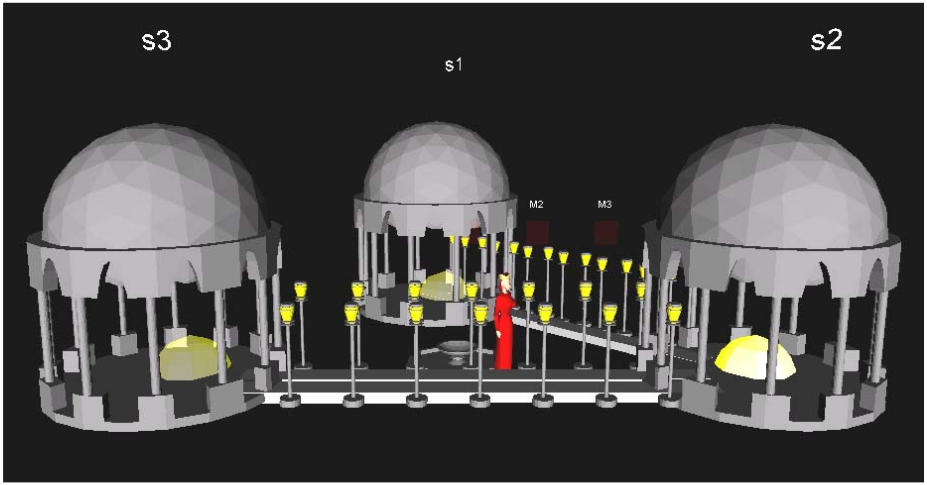
Rube Summary
-
There are benefits to a visualization system that supports 3D models and
external tools. The benefits include richer, reusable visual metaphors, and
better portability.
-
lecture 29
HW4 Report/Show/Tell
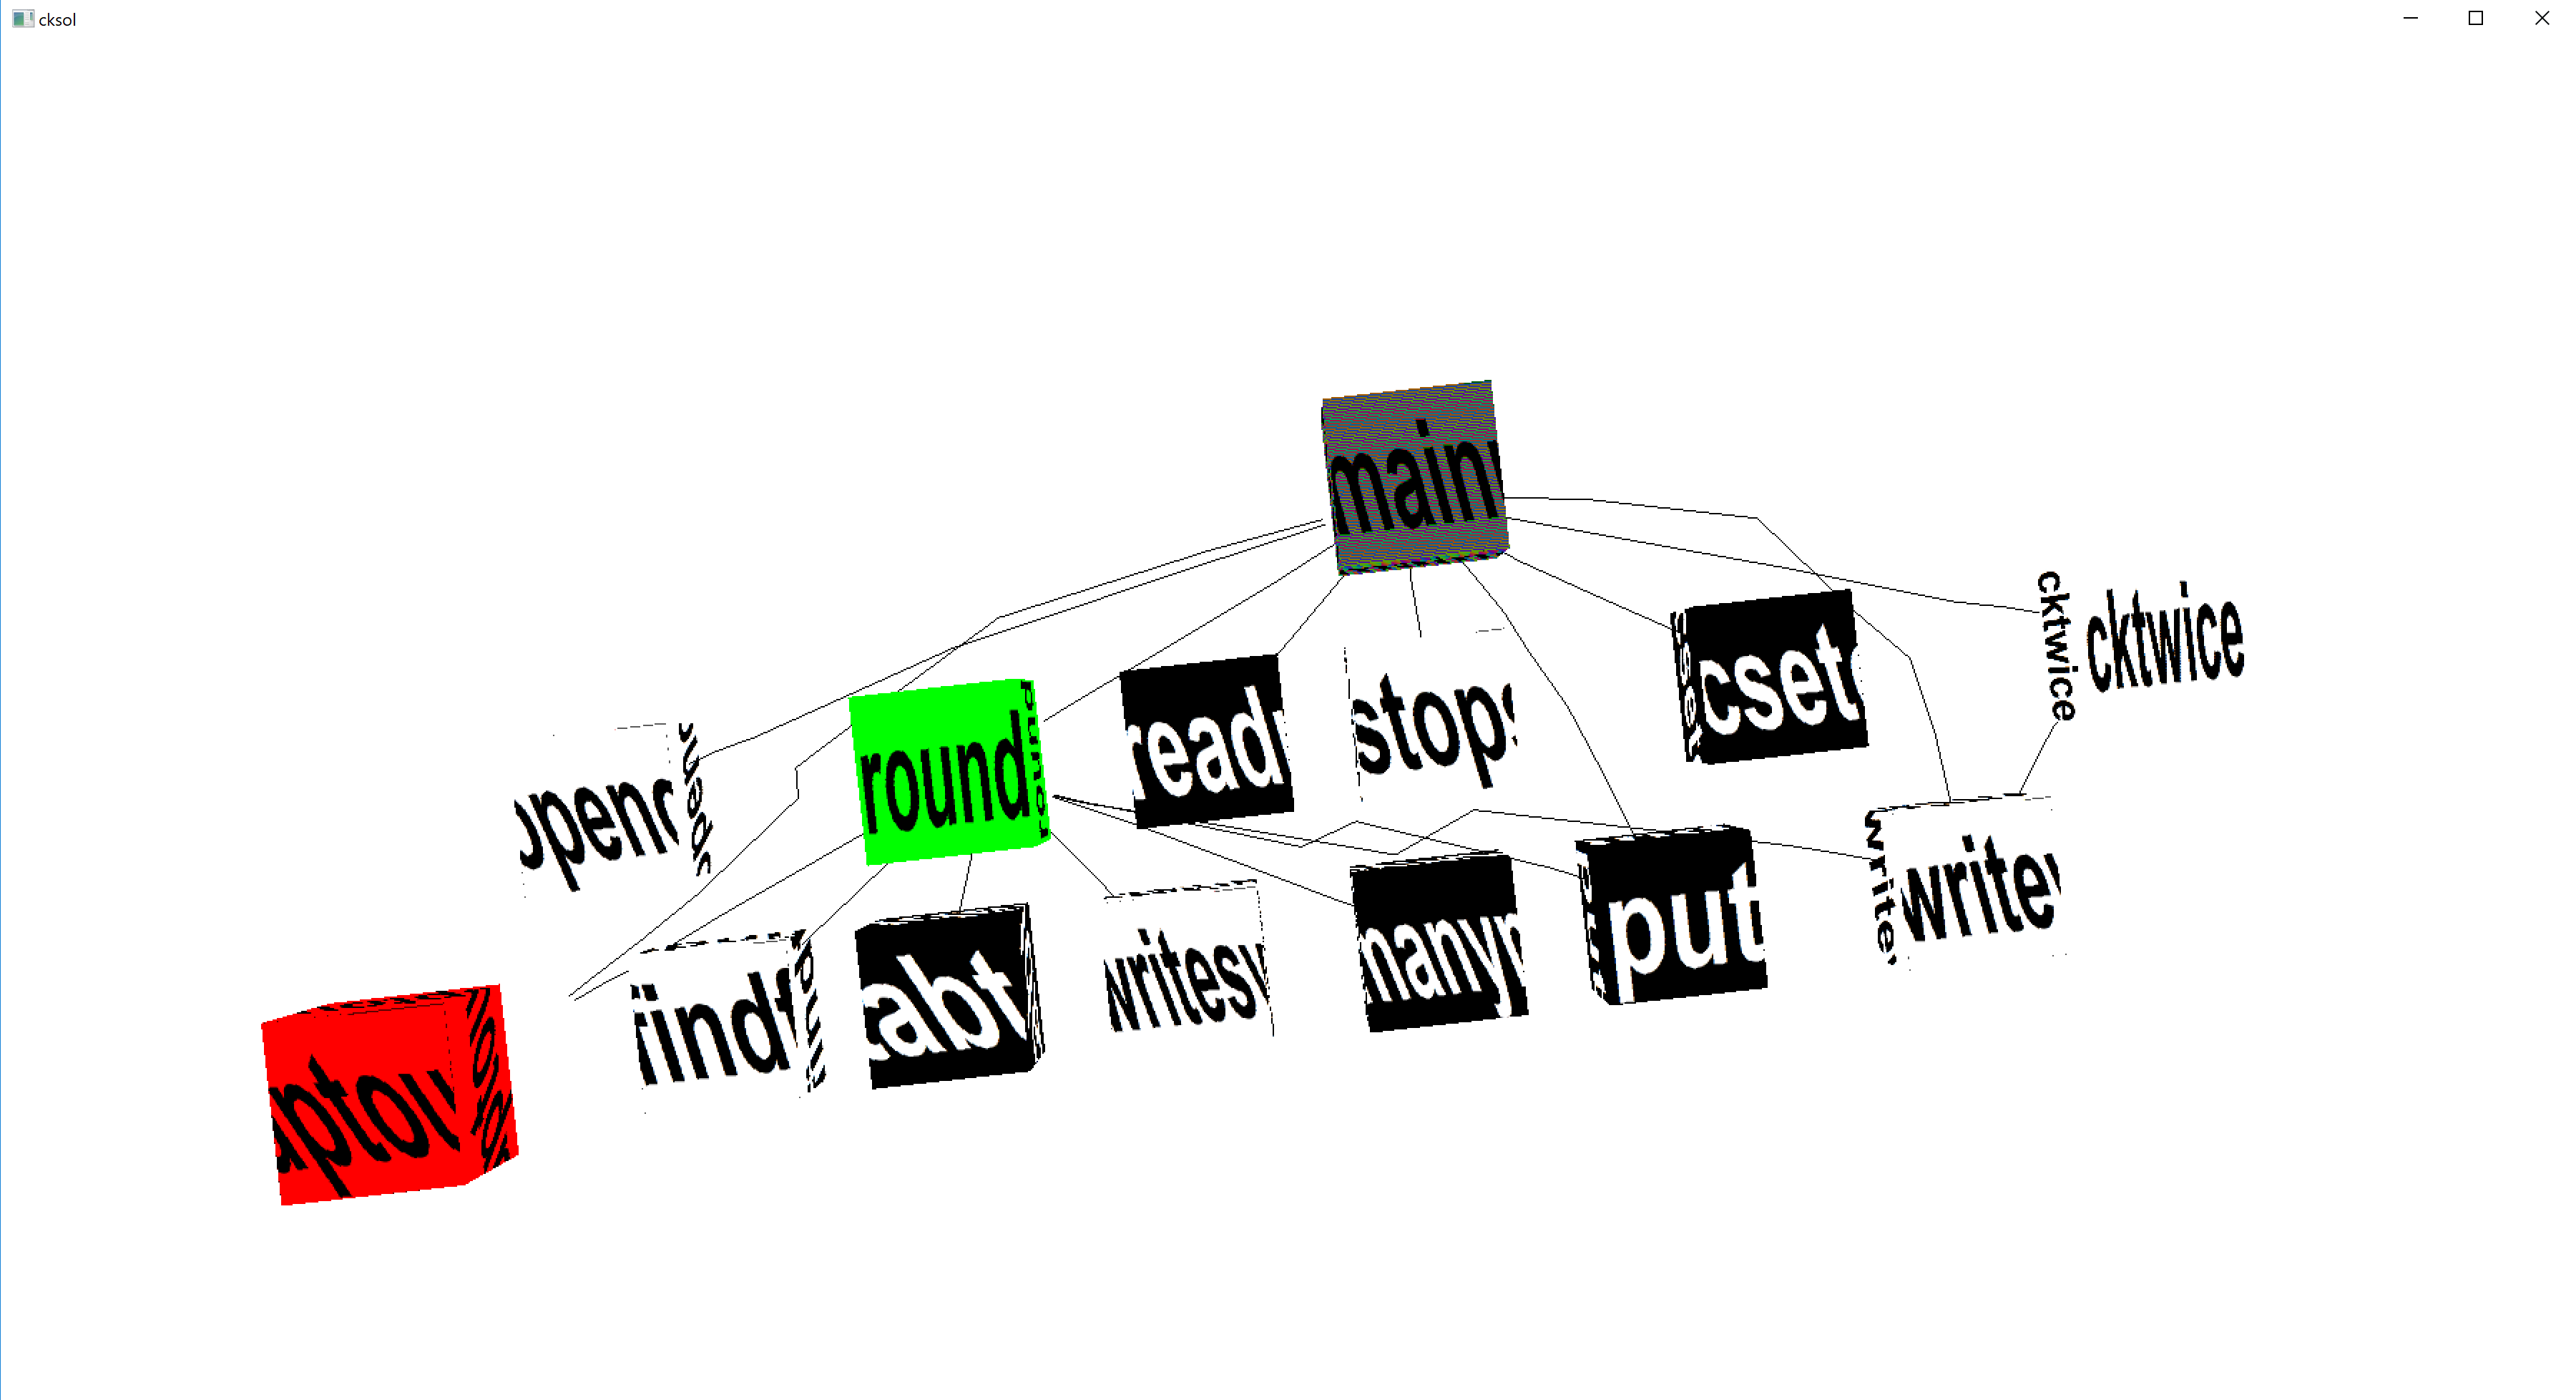
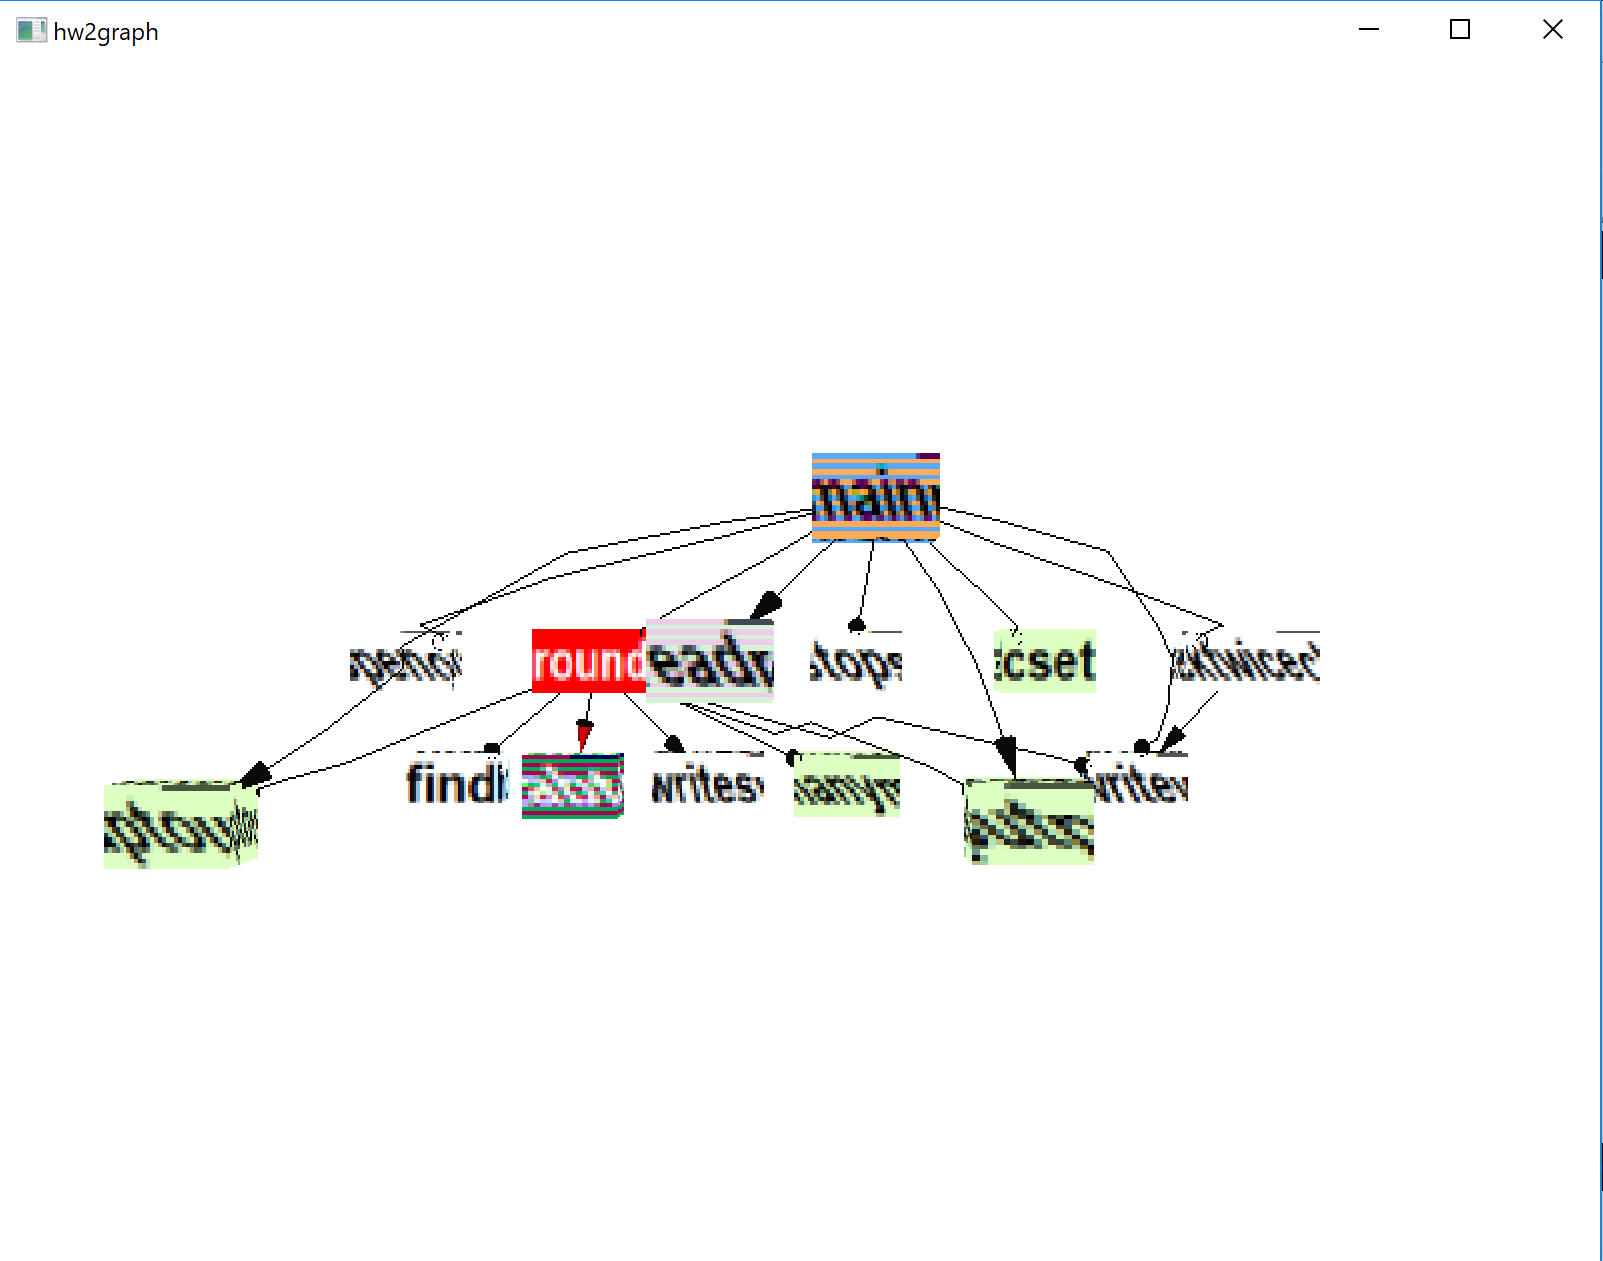
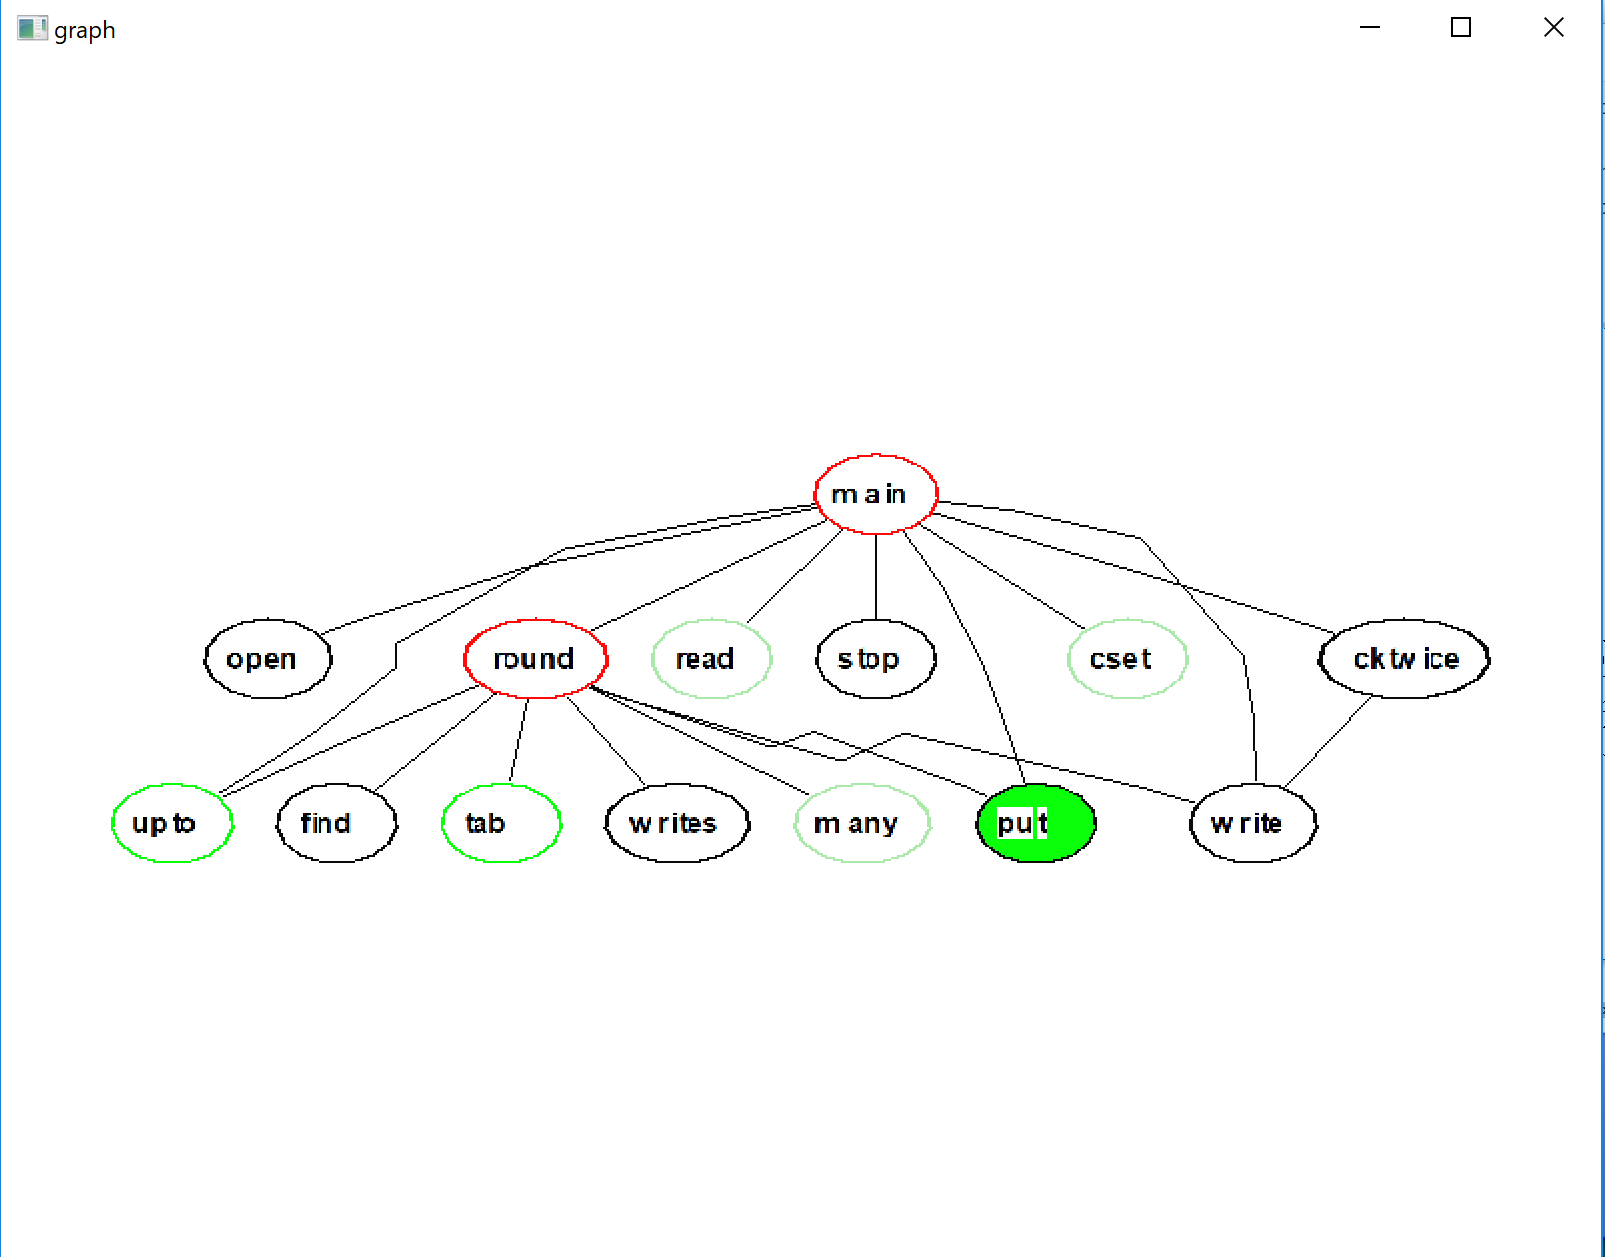
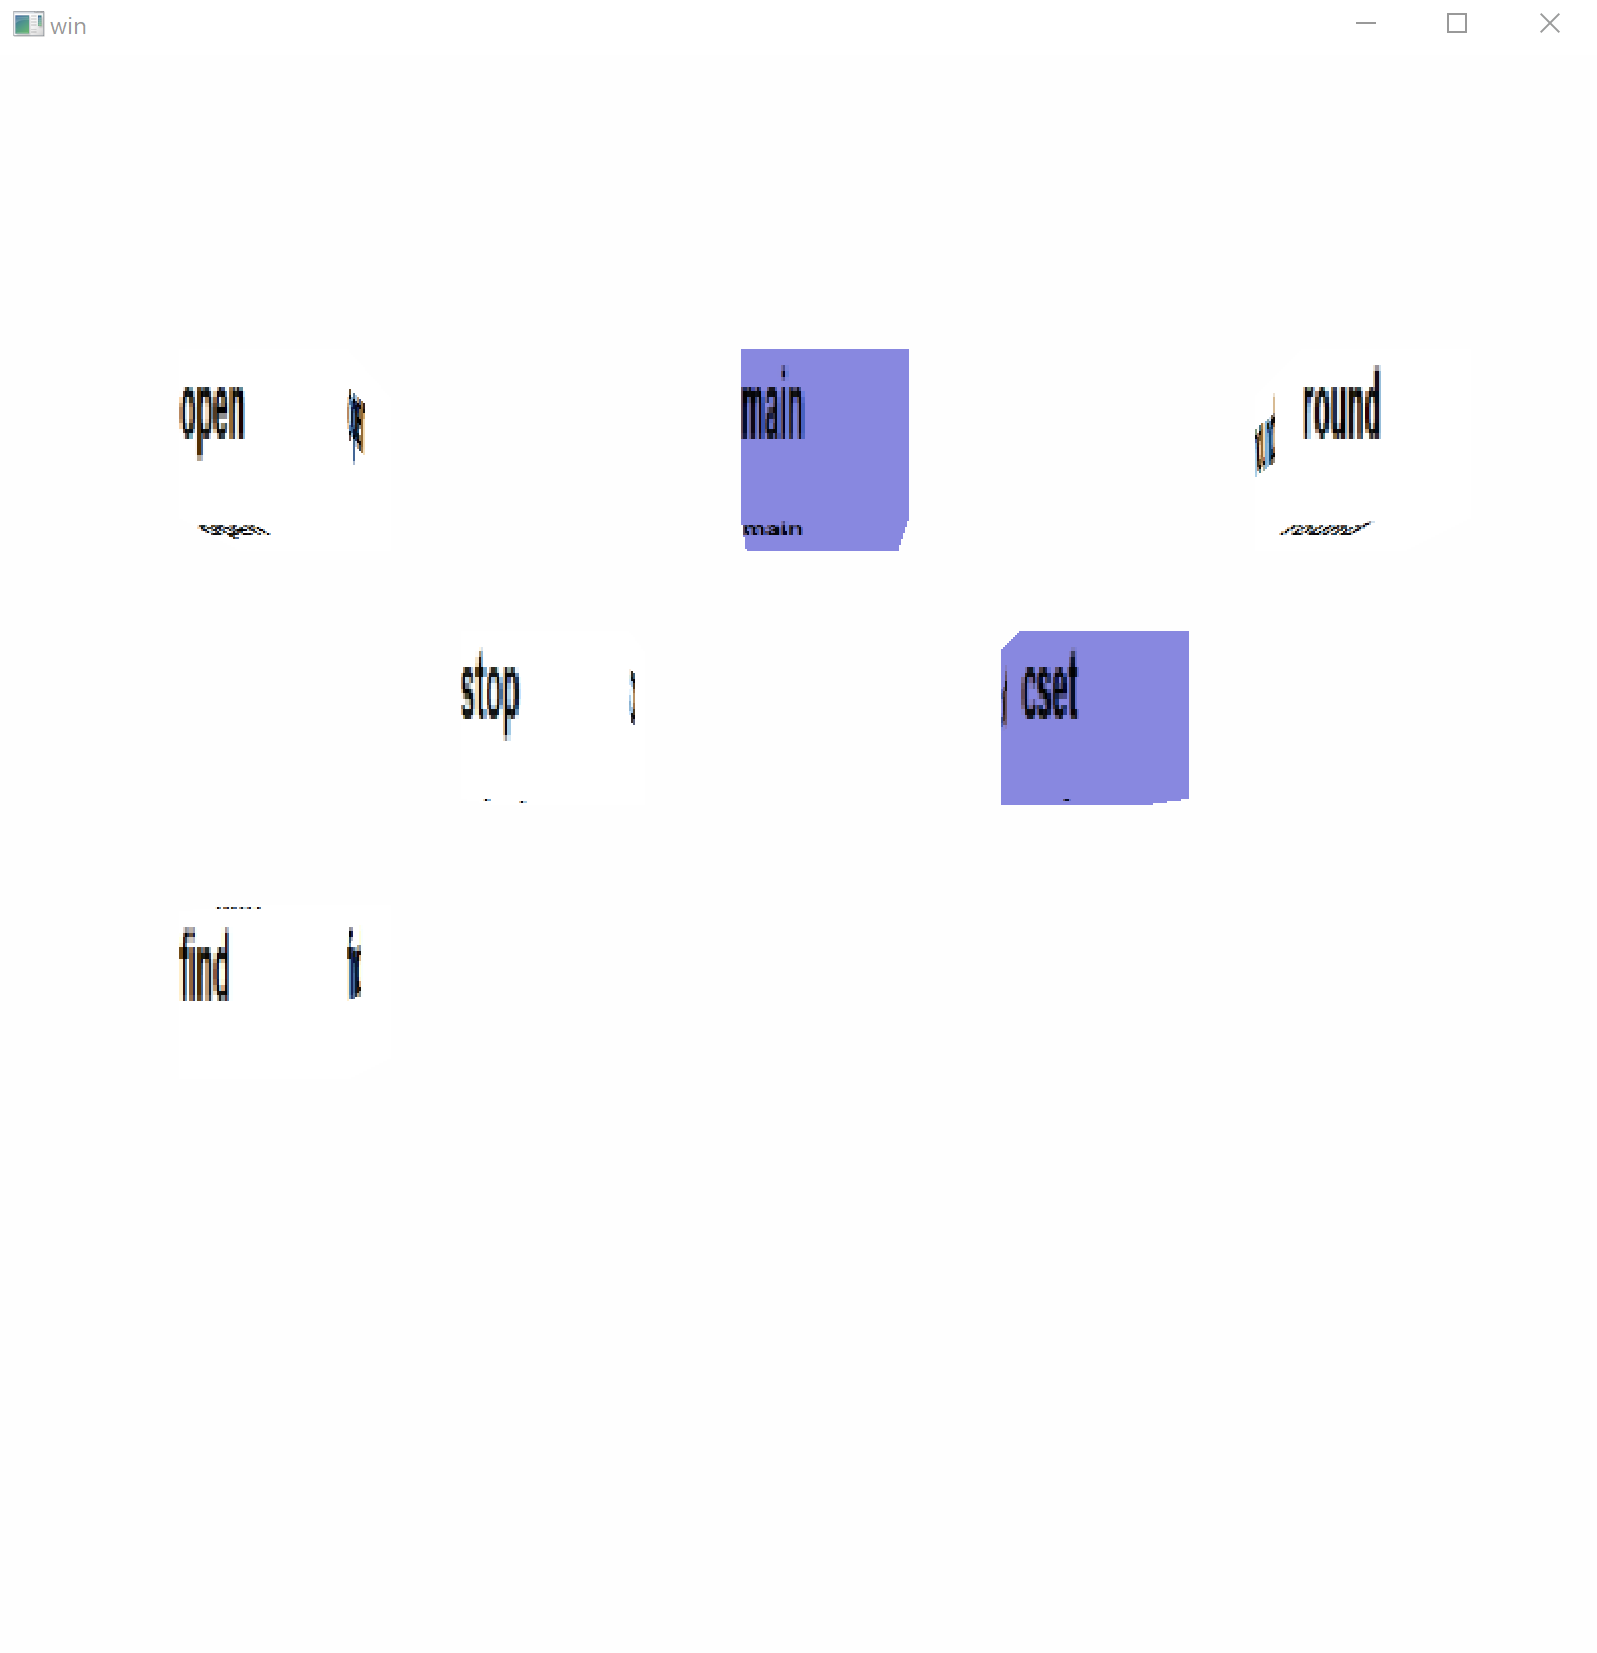
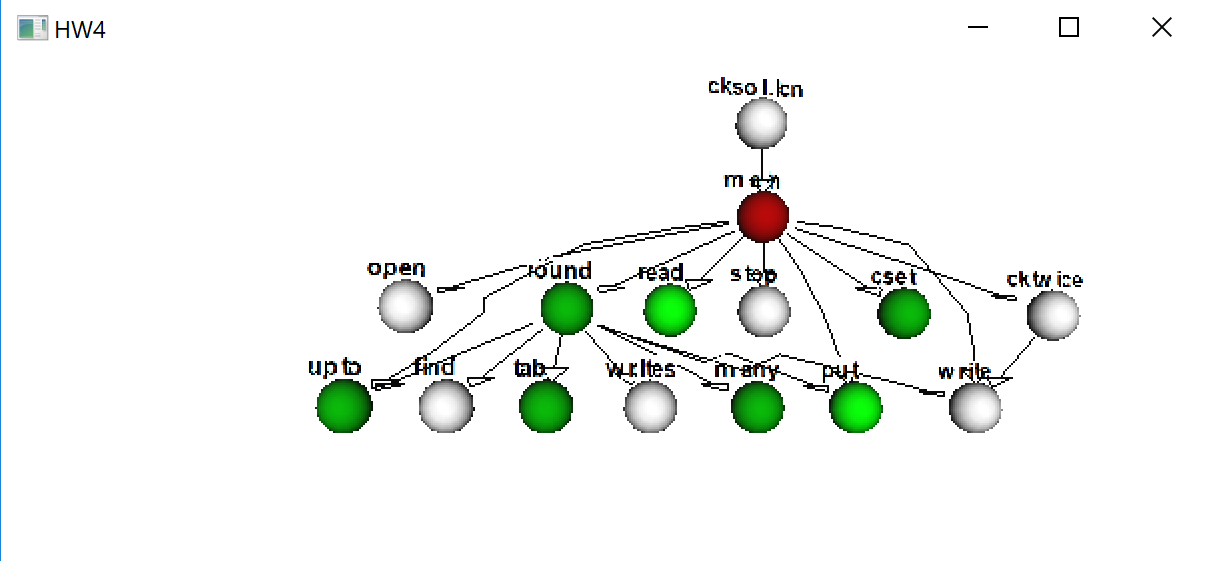
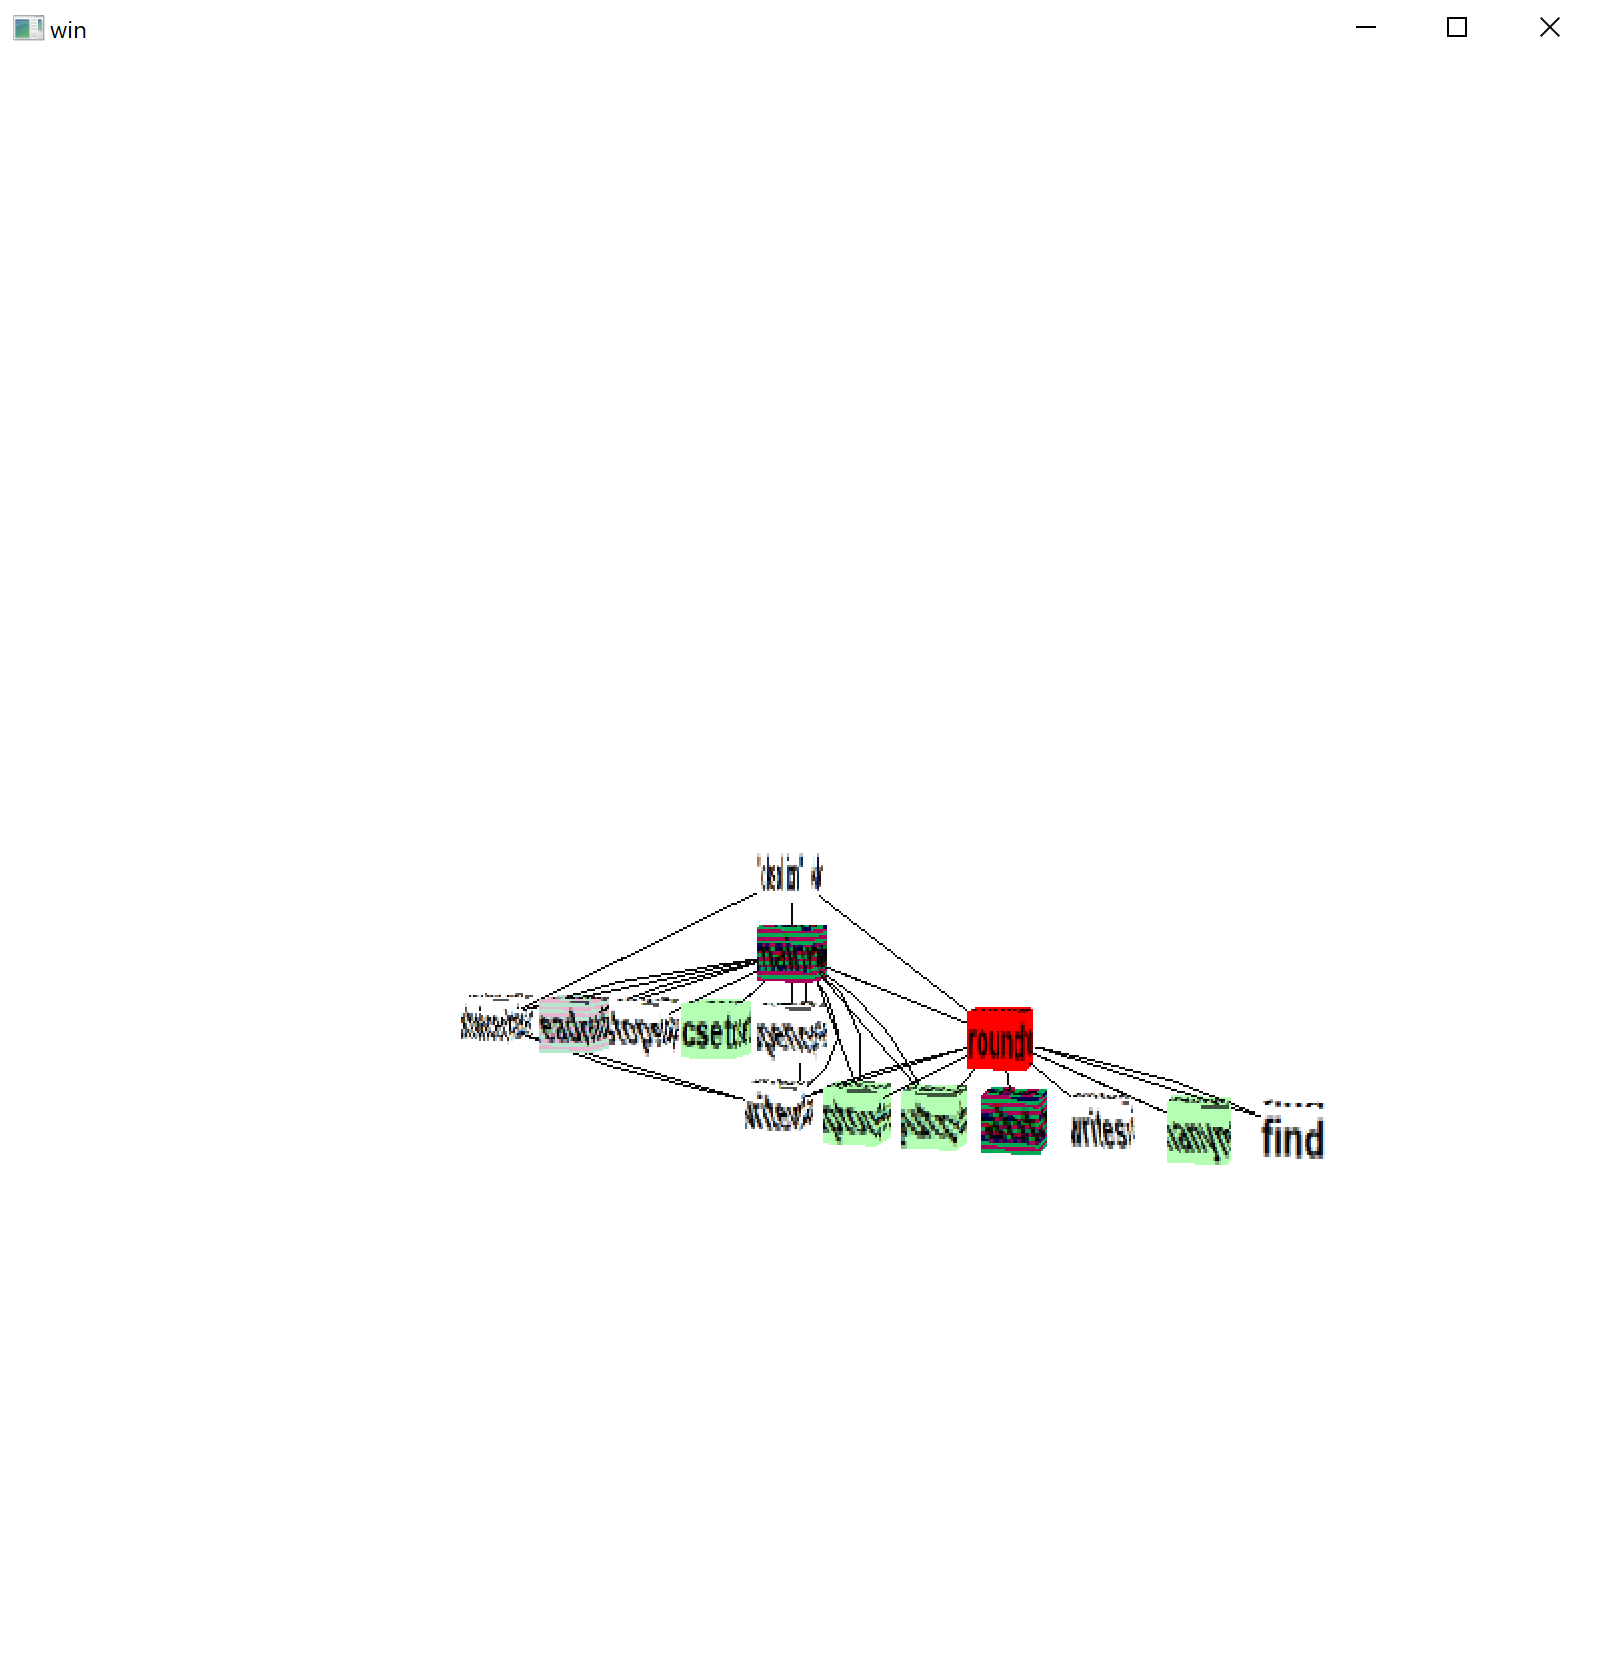
Comments on your HW4 Code
- submitted solutions ranged from 400-700 LOC
- solutions ranged widely both in looks and performance
- did you figure out how to pull out most of the work out of DrawString,
so that it only executes the first time it is called? For example,
re-using the font texture using its display list record instead of
re-extracting it from the wfont window over and over again?
- what fraction of your monitor code is on the critical path executed
repeatedly every event?
- kind of impressed that of you used a co-expression in your own code,
but...in a big loop? probably should re-think that
-
put(numbers, pop(numbers), pop(numbers), pop(numbers))
-
while not member(&digits ++ '.', line[i]) do ...
while ... do ... tab(many(&digits || "."))
-
if = "=" || "." || "," || "\"" then ...
-
i +:= 1
- Which is better:
x *:= -1 or x := -x
-
if (3 < i < *TempL) then ...
-
keyList := [: key(jObject[keysOfjObject[i]]) :] ...
-
tab(upto(',')) ... find('.', filename)
- using evaltree() but also your own EvGet() loop??
- evaltree() callback? Probably should consider using a table of
procedures instead of giant case expression. Or maybe
Hani's trick.
-
if color == ("red"|"green") then ...
if (postpone | cont) == "T" then ...
On Dynamic Analysis
- Dynamic analysis refers to computing higher level
information from program execution behavior such as an event stream.
- In pragmatic terms, dynamic analysis consists additional code and
data structures, besides just a switch/case, applied to the processing of an
event stream, before deciding what gets depicted graphically. Do you
summarize? Compute statistics on it? Place it into categories?
Here is a classic paper on the subject. Grad students, go ahead and read this.
We will skim it today to try and pick out the highlights.
According to Ball, dynamic analysis has the following properties compared
with static analysis:
- greater precision of information, derived from 1+ actual program run(s)
- input-centric mentality; shows dependence of internal behavior
on particular inputs of a given execution
- ability to reveal semantic dependencies that are far apart in scope
Ball's paper mentions (claims to introduce) two particular types of
dynamic analysis, out of myriads:
- frequency spectrum analysis
- analyze frequencies of different kinds of events,
e.g. to identify related computations
- coverage concept analysis
- comparing actual control flow from a set of executions against a
static control flow graph can show what's missing from a set of tests
FSA
- low-frequency operations are generally at higher-levels of abstraction
- frequency clusters -- if foo and bar are both called 1033 times, there
is probably a connection
- frequencies that match a program's input or output domain may reveal
portions of the program related to input or output.
- frequencies can tip you off regarding the big-Oh complexity of an
algorithm
CCA
-
coverage profile
- profile of what was executed (no frequency info)
-
concept analysis
- (T, E), T a set of tests and E a set of program entities,
is a concept if every test in T covers all of E and no test not in T
covers all of E.
Given a (boolean) table showing all the tests and entities, Ball points out
that you can form a concept lattice, and that the concept lattice shows
control flow relationships within 1+ actual executions, analogous to the
kinds produced by control flow static analysis.
More Dynamic Analyses
OK, so where do we find more examples of dynamic analysis?
Here are some more examples of interesting dynamic analyses.
- statistical
- Summarizing data by accumulation or averaging to give the big picture.
_ FSA seems to be an example of statistical analysis.
- pattern-of-interest
-
Parsing event sequences using patterns to find bugs, or even just to find
items of interest. Event pattern parsing must carefully define its
domain, skipping over events that don't effect the pattern match.
Event pattern parsing will usually be done non-deterministically and
maybe in a ``massively parallel'' model. Tools like flex take a
massively parallel set of patterns and merge them into a single DFA,
but not all pattern matching can be so reduced.
- higher-level-events
- one variant of the pattern-of-interest notion is to identify events at
a higher semantic level, such as aggregates of lower level events, or
application domain events
- categorization
- figuring out when a class implements a stack, or is using dynamic
programming, or whether it employs a feature for which a specialized
tool is available
- profiling; coverage
- treating hotspots and coldspots specially; for example the former deserve
extra performance tuning monitors, while the latter deserve extra
typographic paranoia monitors
lecture 30
Reading Assignment
This week you get a very cool paper that is one of the best at integrating
visualization with the views of the code inside a code city.
- Profiling is an important use of dynamic runtime execution behavior
- Classic profilers are text-heavy. Readers can extract useful information
but it is usually just: who are the heaviest overall consumers of time
- Typical GUI profilers will maybe show this as a bar chart.
- This paper: draws a software city, where the height of the building
corresponds to the % of time spent in a method in the last time interval
(k seconds, or milliseconds or whatever)
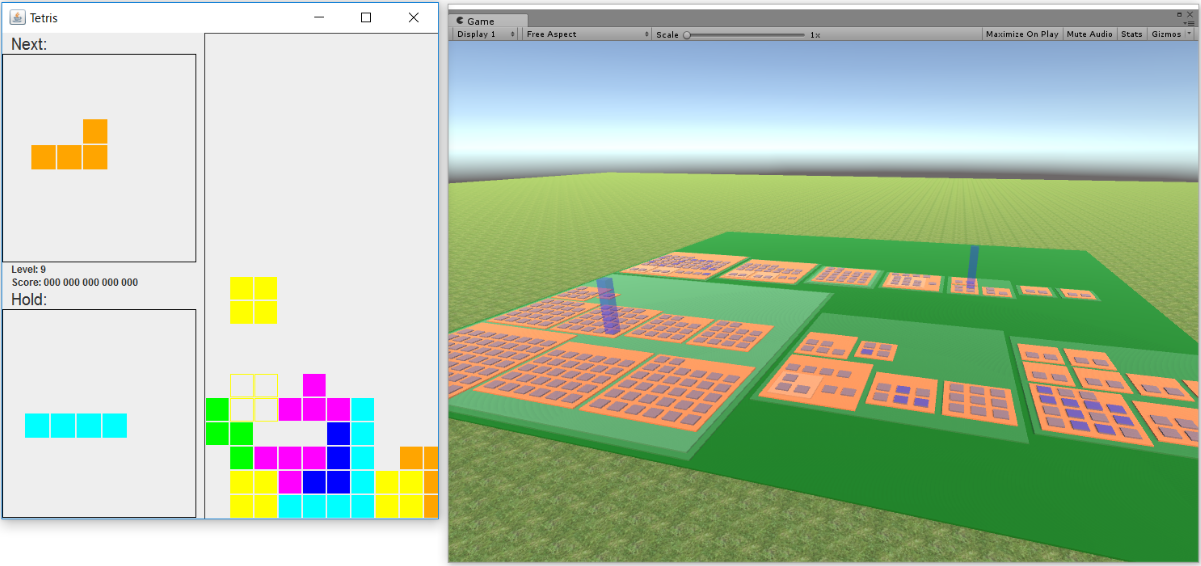
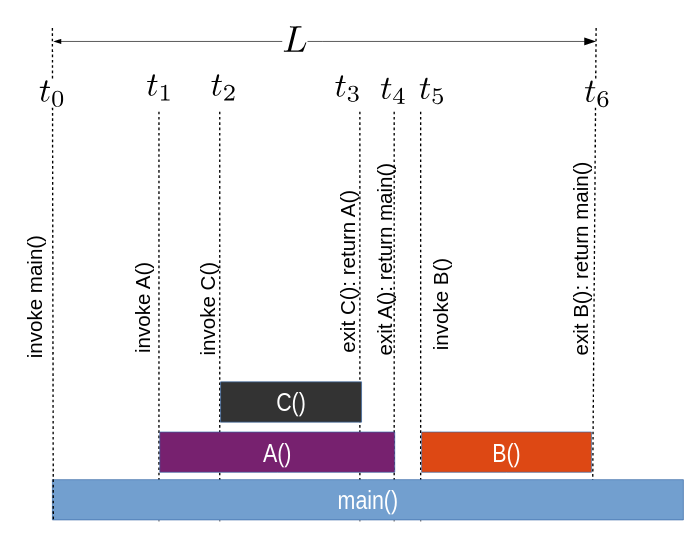
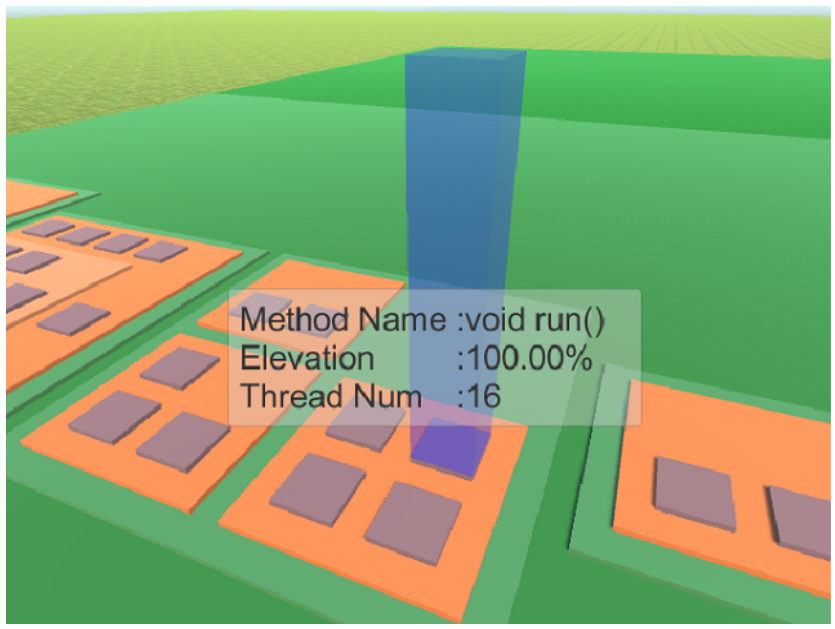
Hey, did you notice that there is an "information visualization wiki"?
Interesting...
Update on Dr. J's Software City Effort
- Windows Unicon 3D is not as stable as Linux Unicon 3D.
- Windows doesn't have as good tools for finding memory issues,
i.e. nothing as good as valgrind.
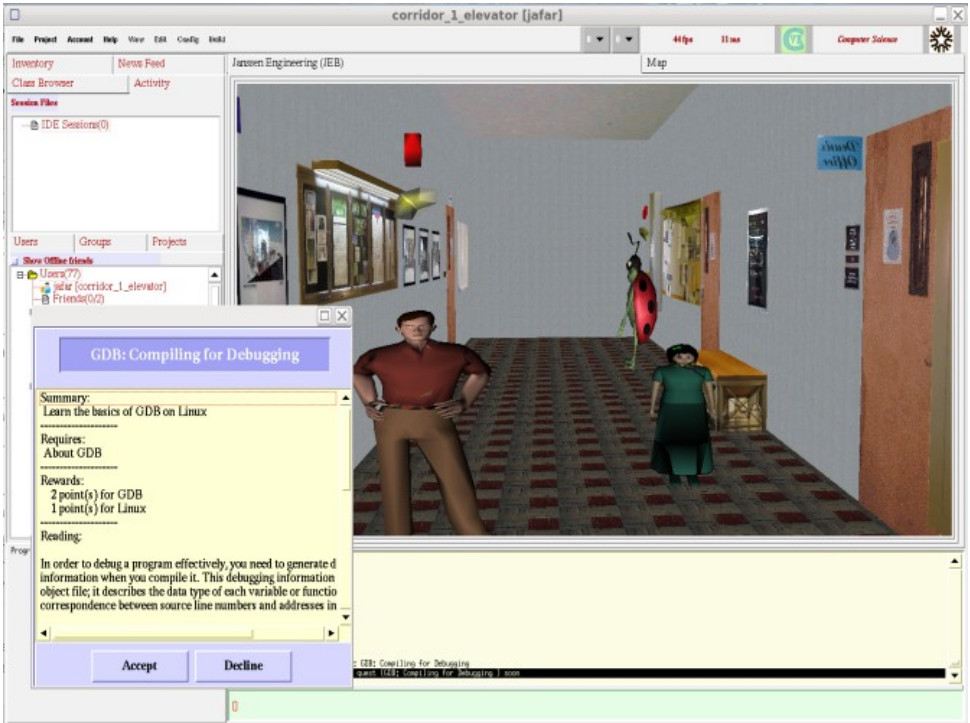
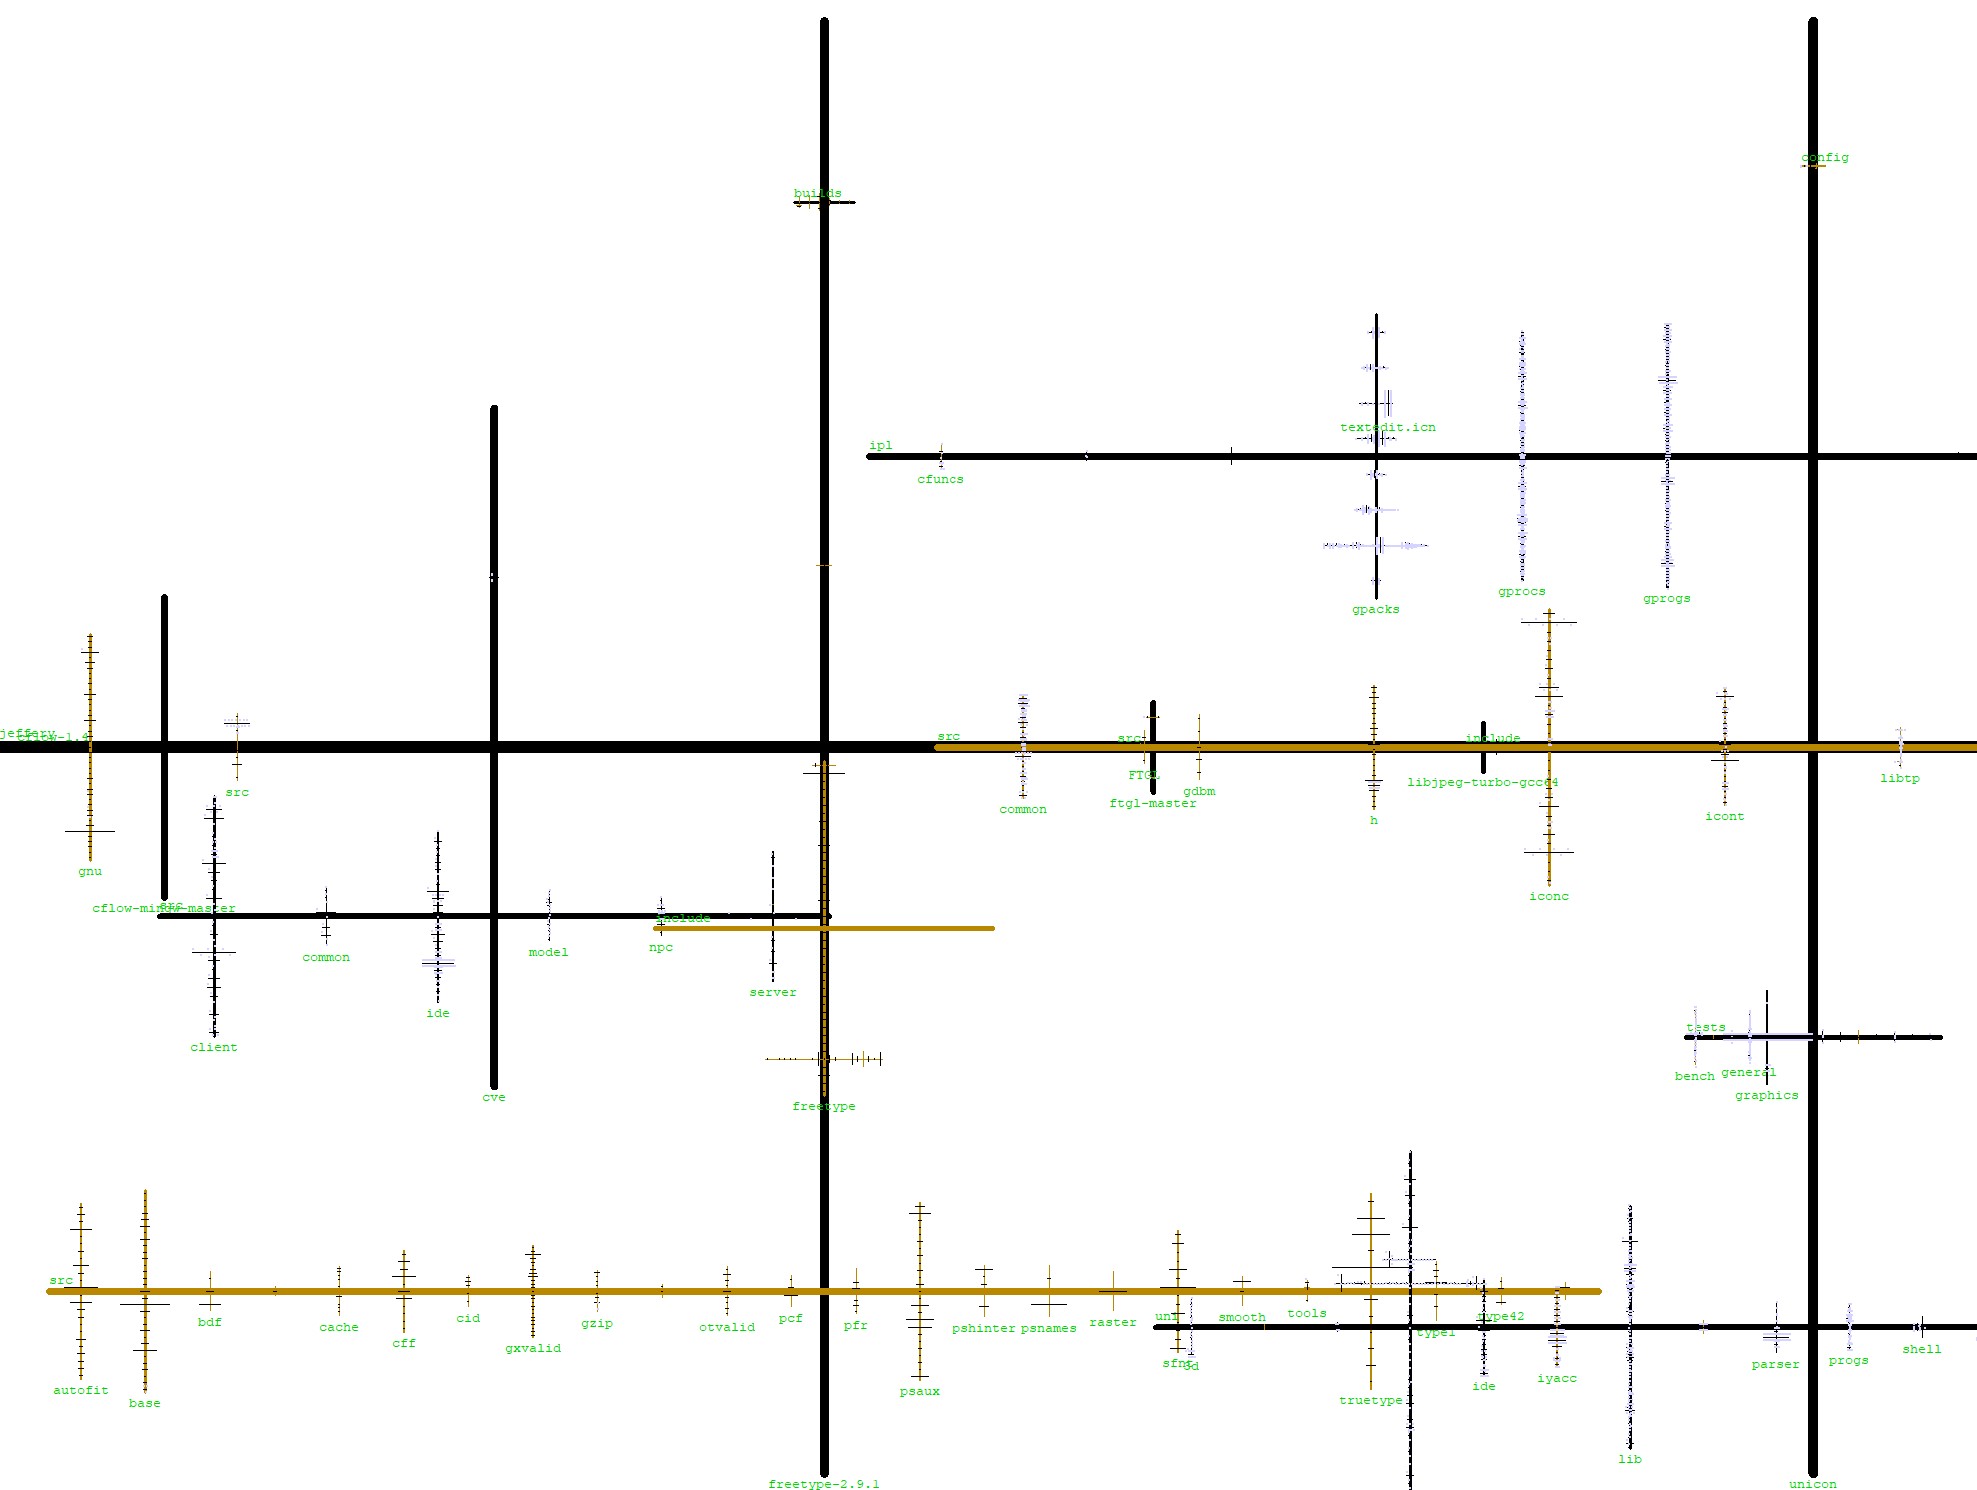
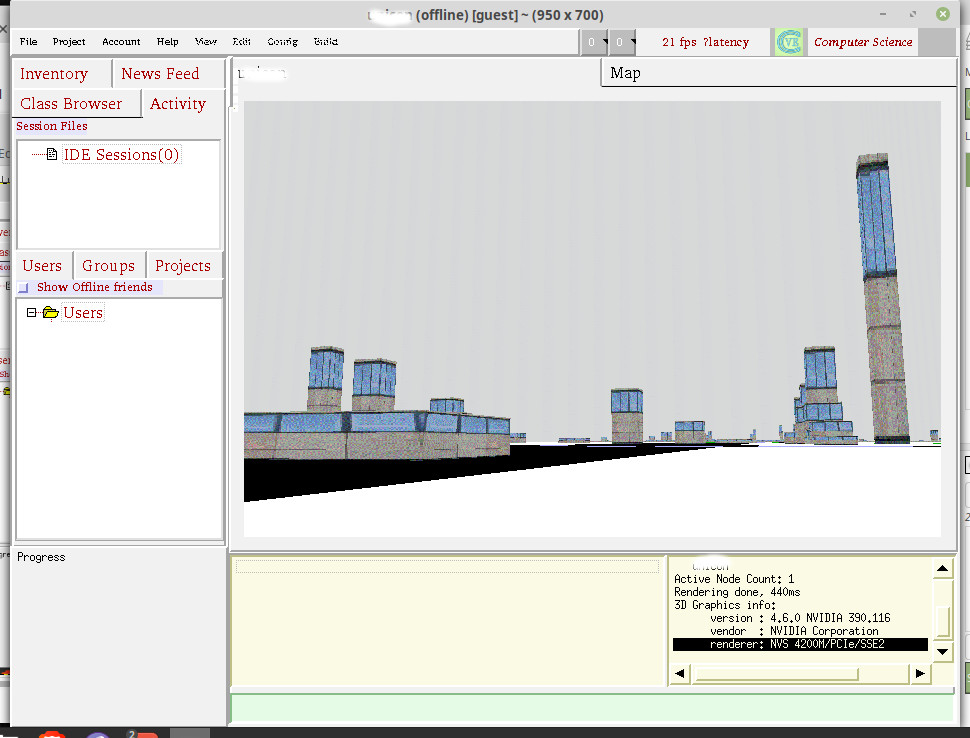
2 1/2 D Visualizations of Call Graphs
(From Facilitating Exploration of Unfamiliar Source Code by Providing 2.5D Visualizations of Dynamic Call Graphs, by Bohnet and Dollner, 2007,
4th IEEE Workshop on Visualizing Software for Understanding and Analysis)
A "short paper" in 2007 gives lots of ideas to think about.
- millions of lines of unfamiliar code
- to add a feature, one must
- identify the relevant "entry points"
- read the source code
- current IDE's poorly suited to this task
- to follow the calls, one is switching constantly between files
- the source navigation tree does not show connections, does not
emphasize the files relevant to the feature under study, and
does not scale well to hundreds/thousands of files.
- no context for navigation, have to go-and-see, can't see-and-go
- idea: use dynamic call graph data to organize navigation activity
- similar a dynamic tracing facility...but the IDE uses the data to
emphasize or structure the navigation bar to the relevent code
automatically.
- superimpose the call graph structure on the source code views
- present a perspective-wall-like view of the call graph...
- apply level-of-detail techniques; present more information for the
nearer / focus nodes where there is space for it.
Nate's Structure Monitor
Simple graphics, reminiscent of Playfair's classic graphic design.
Ya, it is a cheap trick, but it works.
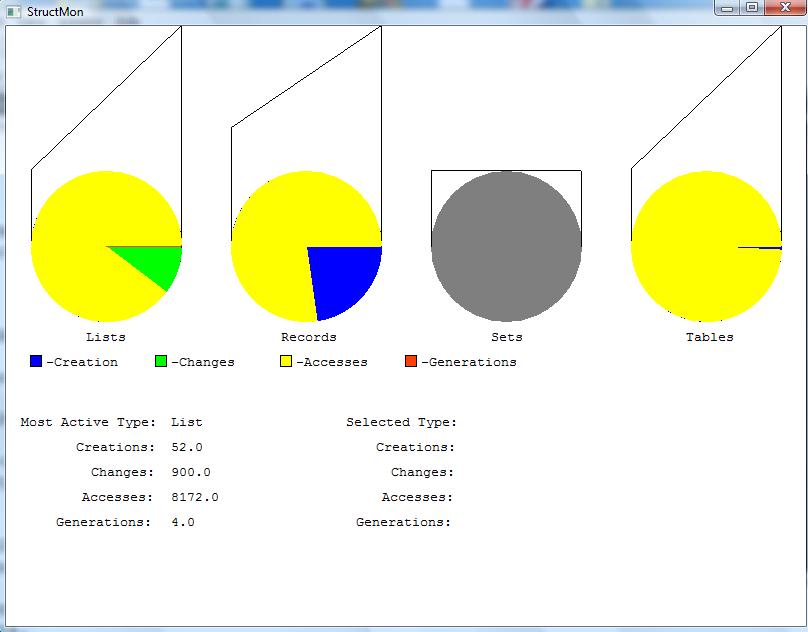
- SV conference pub is a poster abstract; Finnish author has
written some other related papers.
-
Context is novice programmer education, a perpetually popular
SV area.
- Project was done as Flash animations.
- watch panel metaphor for instances
- role metaphors for member variables
- blueprint for class, found in a blueprint book;
blueprint page will visually depict methods, which don't show
on the watch panel
- workshop for method invocation, workbench for its result (lame)
- method call is also visualized as a envelope ("message passing") that
delivers parameters to the watch panel
- object references use a "pennant" metaphor; color is used to match.
No pennants = garbage to be collected
- variable roles include: fixed value, organizer, stepper, most-recent holder, one-way flag, most-wanted holder, gatherer, container, walker, follower, temporary, other
lecture 31
Reminder HW#5 Due Tomorrow Night
Write me your design document. I will endeavor to give you timely feedback
on this one.
Status Update and Demo on Dr. J's Software City
- As reported last class, ~8900 buildings render pretty OK in CVE
despite how slow Unicon is and how primitive its 3D facilities are.
- Essentially: I am procedurally generating a "game level" from a
source code repository. I plan to support several mainstream languages.
- One could do a whole M.S. thesis improving the procedural generation
based on static program information, and making it more human-city-like.
- Monday night was spent changing building heights to correspond to # of
methods in a class, and littler things like improving the sky to not
tile badly.
- 2D city layout size modified to 1024x1024 because texture power of 2;
(should I go with 2048x1024 to closer approximate HD?)
- Current 3D generation is set to "10 meters per pixel". That means
Unicon City is 100 square KM of land. Actually a lot to walk around;
had to modify CVE client to allow for faster movement, need to do more
with that.
- Some surprising happy serendipities: buildings' heights and clusters
of classes looks more organic than expected.
Demo, if the Laptop Cooperates
Jeffery's Current Todo List
I have ~2.5 weeks before my next conference paper deadline.
- come up with a great name
- add to procedural generation a mechanism for mapping source
code locations (file:line:col) to city locations (x,y,z).
What should that mapping look like?
- Design one or more architectures for how the execution monitoring
connects to the videogame. "Easiest" is to just embed it directly
in the CVE client, but that has downsides compared with putting it in
a server, in the long run. "Easiest" just monitors one program at a
time, but the long run should support multiple programs being monitored.
- think about how to incorporate new programs into an existing city
- add a menu item for launching an execution
- add calls to EvGet() into the null handler in cve
- write a standalone monitor that monitors class instance construction
and member variable references.
- how to talk about, produce analysis of, and visualize the fact that some
directories contain unrelated/unordered collections of code,
while others contain members of a single system. Compare the IPL
directory categories: procs (library modules), progs (separate programs
in each file), packs (multi-file programs).
Brainstorming: Visualizing Software Executions as Populated, Dynamic Cities
Help me improve my metaphors.
- integrate CVS logs, bug tracker, static analysis, runtime data
- do this for Unicon, with mix of available and (new, needed) tools
- push "city" metaphor much farther than in previous papers
- overcome various fatal flaws with the whole city metaphor.
Dr. J's fatal-flaw view of visualizing software as cities: many or most
(especially OO) programs are understood largely through their relationships
between classes and between instances. Software as cities doesn't
automatically manage to depict such relationships at all. It got as far
as colocating classes in the same package.
- Classes are buildings, sure
- height=# methods, width=#public variables, length=(log of) longest code.
(Private variables not included)
- What is the model of time in-game?
- Today = a current execution run. CVS repositories and previous execution
logs make for remembrances of things past.
- Limited ("Prince of Persia") backwards-in-time capability?
- limited-reversible is better than no reversible, and is
more scalable than full-reversible. Limited reversible may mean,
if you go back past a certain point, you'll not be able to see as
many details, or change the execution from that point. Assuming
we are collecting fairly detailed traces, you can go backward
farther than that in a replay-only mode.
- How to represent procedures
- treat like a class w/ 1 method. Lotta procedures = village.
- How to represent instances
- As robots? Garbage would be broken-down
robots...lots and lots of broken-down robots! (thanks, A.P.)
- How to represent "atoms" (scalar values)
- Not at all? As text? As virtual books (strings), hammers?? (ints) and
saws?? (reals)? What about tables and lists? Records got special
treatment as people; tables and lists as bookshelves, or buses, or?
- How do represent external entities
-
- network connections, I/O handles, files... need representation
- try and give me some better ideas here.
- what have we seen other folks try? Letters/envelopes...
- In software engineering/software design, an
"association" refers to a relationship between classes or instances.
Why does the metaphor need associations?
- Because making correct code is difficult and perilous.
- Our city is
someplace like venice, or hell, or New York.
- Step off the
sidewalk on the wrong street and you are dead.
-
Associations provide your security.
- What associations are depicted, and how?
- We need at least: inheritance, aggregation, and "other"
- How to depict inheritance and aggregation?
- How have other researchers depicted these? Tubes running into a roof?
- aggregation = adjacency, or containment, or bridges.
- inheritance = physical resemblance
- How to depict reference?
- boats?
- What are the streets?
- In Venice, there are streets. And canals.
- How to represent the stack
-
- Gradually dimming lights in buildings?
- Portals/teleporters/bridges/moving sidewalks?
- Beam of light?
In past discussion, there has been support for the beam-of-light
model, pointing backwards from callee to caller. Dr. J would add:
the beam of light might be a good metaphor for an instant-teleportation
feature...
- How to represent bugs and warnings
- As monsters
- How to layout buildings?
- Around an older, urban core? Minimize distance of overall call graph?
- What are ghosts?
- Remembrances of fixed bugs and deleted code
- How to present source code control structure details.
- There is the raw codesize, the extent of nesting
- How to present data details.
- Well, instances are a lot of the data, and atoms are the rest.
A prime issue here is one of aggregation. When is an object
a citizen of the world, and when is it just somebody's foot?
I guess the answer is: when referenced globally, or by two or
more other instances.
lecture 32
Status of HW#4 Grading
- I have received 7 HW#4 submissions so far.
- I will grade HW#4 as soon as I can, but it will take a bit longer.
- I will print and read your code and make suggestions there
- I will test on several suspects, and maybe on both Windows and Linux.
- Your grade will be based on whichever platform produces the best results
on the tests.
Status of HW#5 Grading
- I have received 7 HW#5 submissions so far.
- I will attempt to grad them this weekend.
Remainder of the Course
- more: research papers
- more: DrJ-tries-to-build-Unicon-City
- but: what do you need to know in order to coolify your semester project?
Question: How to Get More Static Analysis for Unicon if You Need it
- Some of you did a Unicon-based HW#1, some didn't
- We kind of punted some, by putting up .json files for all suspects, fine.
- All that has is table-of-lists representation of a call graph
- What other static information might we want?
- What are our options for getting it?
What Static Analysis Information Might We Want?
What are Options for Getting It?
- Some of what we might want, has already been done by udb.
- How hard would it be to use parts of udb as a library?
- So far, this is my test of this question:
# you would have to adjust these paths to refer you your uni/udb directory
link "/home/jeffery/unicon/uni/udb/icode"
link "/home/jeffery/unicon/uni/udb/srcfile"
link "/home/jeffery/unicon/uni/udb/symtab"
link "/home/jeffery/unicon/uni/udb/system"
procedure main(argv)
   icode := Icode()
   write("Icode file: ", argv[1] | "not supplied")
   src := icode.getSrcFileNames(argv[1])
   write("source files: ", image(src))
      every write("\t", !\src)
   srcFile := SourceFile()
   srcFile.loadSourceFiles(argv[1], src)
   write("srcFile: ", image(srcFile))
   every k := key(srcFile) do {
      write("\t", k, " ", image(srcFile[k]))
      if type(srcFile[k]) == ("set"|"list") then
		every write("\t\t", image(!srcFile[k]))
      else if type(srcFile[k]) == ("table") then
         	every kk := key(srcFile[k]) do {
		   if type(srcFile[k][kk]) == "list" then {
                      write("\t\t", image(kk), ":")
                      every write("\t\t\t", image(!(srcFile[k][kk]))) \ 10
                      write("\t\t\t...")
                      }
                   else
                      write("\t\t", image(kk), ": ", image(srcFile[k][kk]))
                   }
      }
end
Live Demo this one.
More thoughts on How to Make Static Analysis in Unicon Much Easier
Suppose I want tools like the software-as-cities, and its too much work.
- Unicon's monitoring framework makes the dynamic events easy to get,
but how do I make the static info easy enough to grab?
(Today's answer was: make a library from udb + ???)
- The lexer and parser for Unicon are widely available, do monitors
need the type of static analysis they could get from parse trees?
(Discuss static info obtainable from icode VM binary vs. from
list of strings of source code vs. from parse trees and symbol tables)
- What generic static analysis tool(s) should we invent?
- Execution monitoring was modeled as a sequence
of events (
while EvGet());
what should be the conceptual model for a general purpose static
analysis tool?
- Is there a collection of static analysis foundational data,
and a set of generic operations, that is standard, or that
we should standardize?
For example, for a hypothetical Unicon Static Analysis (USA) tool,
analysis produces a tuple (Σ, Π, Χ) where Σ is the
set of source files, Π is the Parse Tree forest, and Χ is the
control flow graph?
Yeah, this is a lame start, but at least it will
allow us to consider what should really be there.
Mondrian
- Viz tools conflict
- gnuplot generality of reading file formats vs.
Alamo-style run-time access to original data.
- Mondrian sez:
- instead
of moving the data to the viz tool, move the visualization tool to the
data.
- Provide not a file format
- but instead, an interface. Allow a declarative
script to specify the visualization.
- Work directly with the objects in the data model.
- Let the programmer visualize what they are doing in their
environment/tools.
- at one time this felt to me like:
- SmallTalk-based tools trying to be relevant to a
non-SmallTalk world.
lecture 33
Mailbag
-
I am currently trying to get all of the procedures from a Unicon program
that is being passed to my hw6. I was thinking of scanning the file and
looking for them, but I don't think this is the best option. Is there a
different direction you can point me to look at and do some sort of static
analysis before i begin to monitor or should i stick to scanning the file?
-
Great question. You could use the udb modules I demo'ed last class to find
all your source files, and then run HW#1 style code.
But, instead of looking for the procedures in the source code, if procedures
is what you want, I think you could scan all the global variables using
globalnames() and if the value is of type procedure, it is a procedure.
Maybe something like
every g := globalnames(Monitored) do
   if type(variable(g, Monitored)) == "procedure" then ...
BTW, beware of "procedure" versus "function". A procedure is Unicon code,
a function is generally built-in, i.e. C code.
-
Here are...what I'd be interested to see for static information provided
- memory requirements for global data
- minimum memory on stack required for each procedure
- minimum heap memory required for program's run time execution, and
- the amounts of minimum heap allocation requested by each procedure.
Included in this could be amount of memory allocated each time
procedure is called, and minimum number of times that procedure is called.
- indicator for procedures that have the potential to allocate more than
the minimum denoted above (procedures called in a loop, memory being
allocated in a loop, etc.)
-
Great list. Let's work on these a bit. Interestingly, some of them may be
statically calculable, but some of them sound more like dynamics to me.
Memory requirements and Sizes in Unicon
- Memory requirements for global data: 16 bytes per global PLUS heap
memory pointed-at.
- Minimum memory on stack required for each procedure:
- Use E_Stack events?
- Are there access functions or keywords that report stack depth
- Oh by the way, Unicon uses two stacks, the C stack and a VM
interpreter stack.
- Minimum heap memory required for program's runtime execution:
would require hard analysis to statically guesstimate, but maybe
pretty easy to derive empirically. Q: how to keep around static
or dynamic analysis results across time and/or multiple runs?
- Minimum heap allocation required by each procedure: hard to be
accurate in all cases, but maybe not too hard to do a crude power bound
- indicator for procedure that have the potential to allocate more than
the minimums: semi-difficult to do statically, maybe easy to do
dynamically.
Reading Assignment
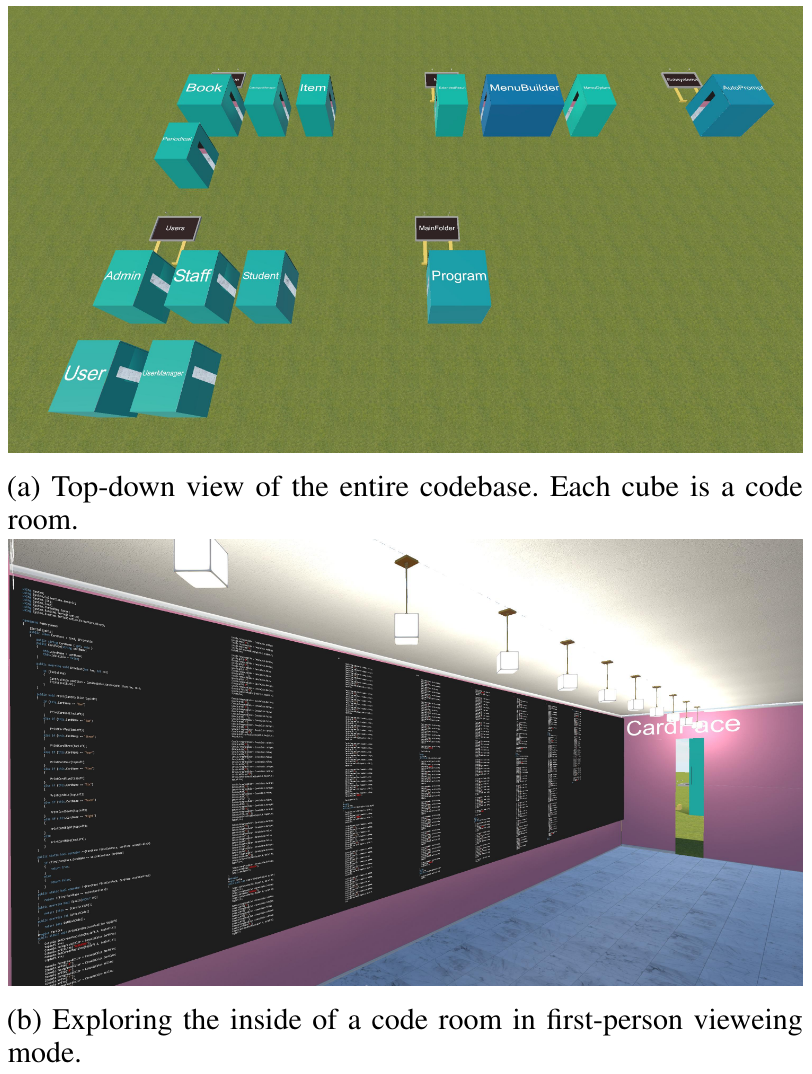
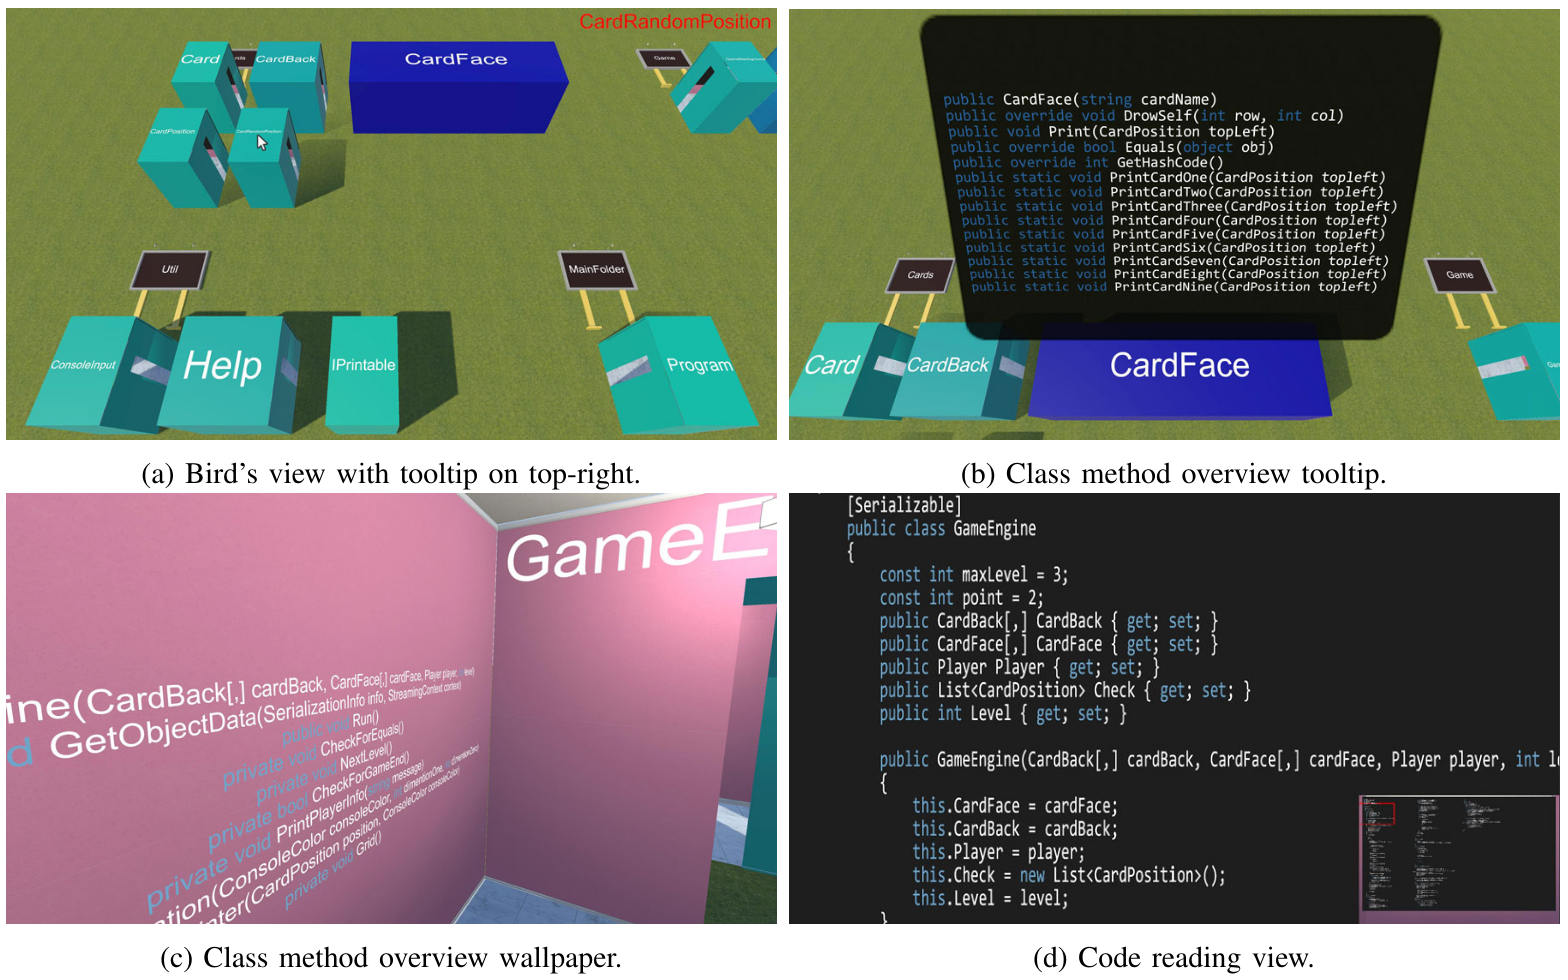
Challenges for InfoVis Engines
- vis. engine should be domain independent
- visualizations should be composed from simpler parts
- visualization should be definable at a fine grained level
- instance-based, not type-based; sometimes different instances
of the same type play different roles
- minimize object-creation overhead
- vis. works off a model of a running system, but instead of
duplicating objects in the system, how about using them directly?
- visualization description should be declarative
- compare w/ Tango, Dance, and UFO for that matter
Other Mondrian Highlights
- Declarative Syntax which look like...
-
view nodes: model classes using: Rectangle withBorder
   forEach: [:eachClass | eachClass viewMethodsIn: view]
- Screen-Filling System
-
Mondrian has a lot of structures to visualize simultaneously...
And it has structures that are too wide to fit the window.
- Built on top of Moose
- You just know it has to be good.
- Interesting Mention of CodeCrawler
- "visualizations of combined metrics and structural information"
lecture 34
Static vs. Dynamic: Memory Size Requirements, Take Two
| Static | Dynamic
|
|---|
enumerate
globals
|
   parse all source code
      including includes and linked library modules
or
   "parse" the binary.
      It has a header, might be compressed
      Header includes "pointer" to array of globals
      udb has of some of this; see icode.icn
      # of bytes of globals is Gnames-Globals
      note...global names are also part of their memory cost
|
   G := [: globalnames(Monitored) :]
   write("there are ", *G, " globals, including procedures")
|
|---|
size
globals
|
- Unlike traditional compiled mainstream languages Unicon does not
have pre-initialized variables, other than procedures.
- The icode does have a constant region of known size (Filenms-Strcons)
- Although it is called Strcons and holds a lot of strings,
it also holds cset blocks, and previously held real #'s as well.
- From parsed code or binary, static analysis starting from main()
could identify some variables that are always initialized
|
16 bytes per global, 16 bytes for the slot to hold its name
Sizes of pointed-at values are mostly calculable, on 64-bit machines
they are 16 bytes per
slot, plus some overhead for headers, pointers, etc. It is
difficult to find out from a structure value, how many list element
blocks or hash table buckets it is using.
|
|---|
enumerate
locals
|
   parse source code, build symbol table
or
   "parse" the binary
      the icode for each procedure has a "procedure block"
      that contains relevant information (see struct b_proc from rstructs.h)
|
   P := [: paramnames(Monitored) :]
   write("there are ", *P, " params")
   L := [: localnames(Monitored) :]
   write("there are ", *L, " locals")
|
|---|
size
locals
|
On the stack: 16-bytes per local and parameter.
In static memory: 16 bytes per name.
Not counting any heap memory they point at.
|
Regarding measuring stack depth before/after a call, earlier I mentioned
an E_Stack event that reports changes in stack depth. This is for the VM
interpreter stack. There is also an E_Cstack event, but
it looks to me like the grad student tasked with it did not implement it
correctly.
|
|---|
size
heap
entities
|
No heaps at compile time. Static analysis could determine for some
parts of the program that are guaranteed to work, some amount of the
heap allocation that would occur.
|
- String: 1 byte per character.
- Cset: block of X bytes of overhead plus a 32-byte bit vector
- List: 16 bytes per slot, plus any data pointed at, plus list header
block (96 bytes) and one or more list element blocks (56 bytes). Element
blocks grown via put/push hold a lot more slots than are actually used
- Table: 64 byte header + var. size hash table starting ~288 bytes? + 56 bytes/element
- Set: 64 byte header + var. size hash table starting ~288 bytes? + 40 bytes/element
- Record: 48 bytes of overhead plus 16 bytes per field
- Object: 80 bytes of overhead plus 16 bytes per field
|
|---|
On the monitoring of OOP Behavior
Consider the program
class C(x,y)
   method m(a)
      write(a, ": x,y: ", image(x), ",", image(y))
   end
initially
   x := 1
   y := 3.14
end

procedure main()
   o := C()
   o.m("hey")
end
- Running it results in around 400 events.
- Maybe we just want to know:
- whenever an object instance is created,
- when a method is called,
and
- whenever a field is read/written.
- How many of those 400 events do we have to look at?
- How might an execution monitor build a model of
the objects in the target program?
Thes questions boil down to: what dynamic analysis of the event stream do we
have to do in order to turn it into useful higher level information?
| construction |
- E_Fcall for a function whose image says "class constructor C__state"
instead of "function whatever"
- E_Fret from that function call returns the created instance itself
- an instance's image is
"object C_serial#(numfields)"
|
|---|
| method call |
A call to o.m() is an E_Pcall to a procedure whose name is C_m, with an
extra parameter for o on the front.
|
| field access |
A field access is an E_Opcode to the Field VM instruction, resulting in a
E_Rref on the object, and an Rsub identifying the field.
|
A serious side consideration: if the monitor holds direct references to
object instances, those instances will never become garbage. Need to
think about this one some more.
Play around with this interactively in moncls.icn
lecture 35
- in order to map member variables, some class "modeling" in the monitor
- visualization will want to spawn robots at point of object creation, so
where is that, exactly? -- could ask keyword("line", Monitored) but
E_Loc gives better answer !? So use/remember last E_Loc before E_Pcall.
Mapping Code to World Coordinates (and maybe vice-versa)
- need to map code locations to (x,y,z) world locations. This
probably needs to be output by the program that generates the world,
which knows the (x,y,z) coordinates. The prototype is
cod3d.icn
- What are "code locations"?
- In file system terms this might come down to sourcepath/file:line:column.
- In language terms a location might be more about scopes:
package/class/procedure
- The buildings correspond to named procedures and classes.
- So what should the API for that mapping even look like, anyhow?
# given a procedure (and scope) what [x,y,z] location is it at?
#   note: names get reused in different scopes
procedure symbol2world(procname, classname, packagename) : list
    # determine/compute filename, lookup in a table of [filename||":"||symbol]
Other possibilities:
# given a filename, line number, and column, return a [x,y,z] location.
# this will be needed when we have buildings' internals mapped.
# for now, it might calculate from a source location, what building is it in?
procedure source2world(filen,lineno,colno:1):list


# given a procedure (and scope) what filename, line number is it
# this has surely been done in udb. Look for it.
procedure source2world(procname, classname, packagename):list
- What data structure does this need?
table[filename] --> ???
- So far, cod3d.icn generates something like this
model.json. Almost-legal json,
raises whole new cans of worms.
- Aside from syntax, how
would you improve the JSON to make it more usable/useful?
- What do our static analysis
tools (and for that matter, our visualizations) do about
multiple versions of the same function, under ifdefs for example?
More on Visualizing Dynamic Memory Allocations
- Earlier we (briefly) saw mini-memmon
a tool that visualizes heap in a fairly literal way.
- In our earlier demo which ran for several seconds, we didn't see a
garbage collection. Why is that?
- Early garbage collecting languages could spend 10-20% or more of their
execution time in G.C.
- G.C. cost was one of the contributors to the bad
performance reputation of Lisp, SmallTalk, etc.
- Very fancy research was done to reduce cost of G.C.
generational collection can reduce it down to maybe 5%?
- Those numbers (10%, 20%, 5%...) were based on 1970's and 1980's
memory sizes. Given, say, a 100,000x
- Programs might run for a long time before they collect. Ralph Griswold
often said that "most programs don't ever garbage collect".
- By mid-1990's, machines large enough that commercial Java shipped
with a "promissory garbage collector"...and got away with it.
Making Unicon Garbage Collect, for Science
- Garbage collection used to operate out of two 64KB regions: string and block
- Modern Unicon operates out of two regions sized to 1% of available memory.
- Three ways to make Unicon monitor a program with small regions:
- Reduce available memory before launching program (bad idea)
- Set environment variables STRSIZE/BLKSIZE
- Pass strsize, blksize as arguments to
load()
- In the bowels of evinit.icn are lines that look like like:
&eventsource := EventSource := Monitored := load(f[1],f[2:0],input,output,error) | fail
- But it turns out
load()'s full signature is:
load(s,arglist,infile,outfile,errfile, blocksize, stringsize, stacksize)
- So, you/we could easily hack EvInit to take region size arguments
"Turning CVE Into a Visualization Environment" Update
- How to get live/dynamic data into my CVE
- turning it from a collaborative virtual environment,
into a collaborative visualization environment
Start with: how to wire together CVE Architecture with Alamo Architecture?
- CVE runs standalone, but normally uses a traditional client/server
two-process TCP socket-based architecture.
- Unicon uses Alamo, a single-process synchronous thread-based architecture
- Want: multiple users, running multiple programs, to (be able to)
see each other's program behavior
- Want: lots of little computer controlled NPC's running around
- Possible solution 1: CVE client is the EM
- Pros: can develop standalone mode initially
- Cons: need to develop way for others to see what you are seeing
- Possible solution 2: CVE server is the EM
- Pros: server is the logical space for shared environment entities
- Cons: server can be a bottleneck; server must remain robust
- Possible solution 3: another client is the EM
- Pros: we already have some infrastructure for computer-controlled
characters (NPCs) written as clients
- Cons: increases latency; reaction to program event is now two
(buffered) network packets away from client
- May need to extend CVE network protocol to handle multiple avatars
managed from a single client ("Legion")
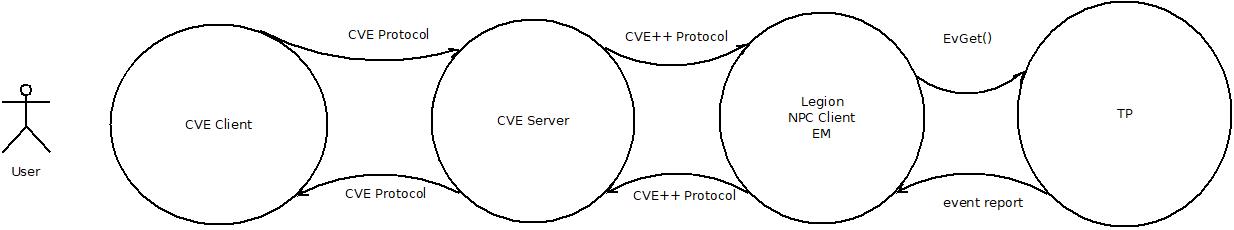
lecture 36
Mailbag
- I have been trying to get the time spend on each function.
What I have tried so far is recording the
&time
during an E_Pcall() then recording the
&time during an E_Psusp or
E_Pret and subtracting that from the E_Pcall
time to get the time spent. The trouble I'm having right now is that
those times are coming back with the same value giving me 0 when I
subtract them. Do you have any suggestions on how I can approach
timing functions.
- Great question. Let's talk some more about timing.
More on Execution Timing
Earlier when we talked about timing, I gave examples
that use the Unicon &time keyword, but a student has
clearly found and reported that it is not always sufficient.
- Machine "cycles" are billions per second, but how precisely can we
measure time in a pre-emptive multi-tasking operating system?
- The underlying hardware has fundamental limits, as does the
operating system. Traditional "clock ticks" are 10ms on Linux, 55 ms
on classic Windows. On a modern system a program (or function) has
to run a long time in order for timing to be remotely accurate.
- When you evaluate
&time, the Unicon runtime
makes a C library call to ask what time it is (or how much CPU
has elapsed) and which library function is used determines what
you get.
- on UNIX/Linux, &time uses getrusage(), or clock_gettime(), or
times(), or sysconf(_SC_CLK_TCK).
We have gone to a fair bit of trouble to use the best one available.
- On Windows it seems to be using an ANSI C function called clock().
There is some experimental Windows code for a better clock precision
that is #ifdef'ed out.
I am inquiring with our main Windows Unicon developer, Jafar, to see
if we can improve the Windows implementation to address this.
- In the meantime, some experiments:
procedure main()
    t1 := &time
    f(10000)
    t2 := &time
    write("f() took ", t2-t1, "ms")
end

procedure f(n)
    every i := 1 to n
end
Somewhere between ~7500 and 50000 the #ms
will report in as nonzero. If you were an aggressive student of Unicon
you might bump into the function gettimeofday() which reports wall clock
time not CPU time, but might seem to be hopeful since it reports in
microseconds, not milliseconds. However, on Windows it might not actually
be any more precise:
procedure main()
    t1 := &time
    g := gettimeofday()
    f(100000)
    t2 := &time
    g2 := gettimeofday()
    write("f() took ", t2-t1, "ms")
    write(image(g), " vs. ", image(g2))
    every k := key(g) do write("\t",k,": ", g[k])
    write("vs.")
    every k := key(g2) do write("\t",k,": ", g2[k])
    write("gettimeofday reports ", g2.sec-g.sec,"s ", g2.usec-g.usec,"usec")
end

procedure f(n)
    every i := 1 to n
end
- Monitoring and counting VM instructions elapsed, or E_Tick events,
might give you alternative ways to measure computation expended, but
monitoring VM instructions is expensive, and E_Tick events should be
charged evenly against all the code since the last E_Tick event, not
just where the PC is at the time of the E_Tick, or you are just doing
random sampling (like gprof). By the way, if you run for a long enough
number of E_Tick events, random sampling is not a bad statistical
approximation of overall time spent.
Reading Assignment
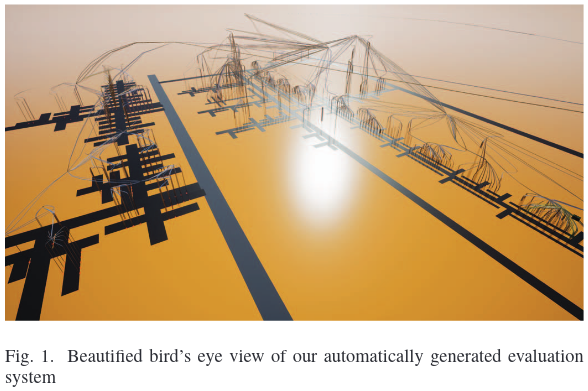
- What was the controlled experiment?
- Hypothesis #1: Users navigate more effectively and efficiently in
EvoStreets when they use a 3DHMD instead of a pseudo 3D desktop system as a
displaydevice.
- Was this confirmed? Is it generalizable?
- Hypothesis #2: Users who are familiar with navigating using a keyboard
in computer games achieve higher task completion efficiency.
- Was this confirmed? Is it generalizable?
- Hypothesis #3: Users who are already familiar with the EvoStreet of a
software for one particular metric mapping can navigate equally well if only
the metric mapping changes (same structure, same starting point).
- Was this confirmed?
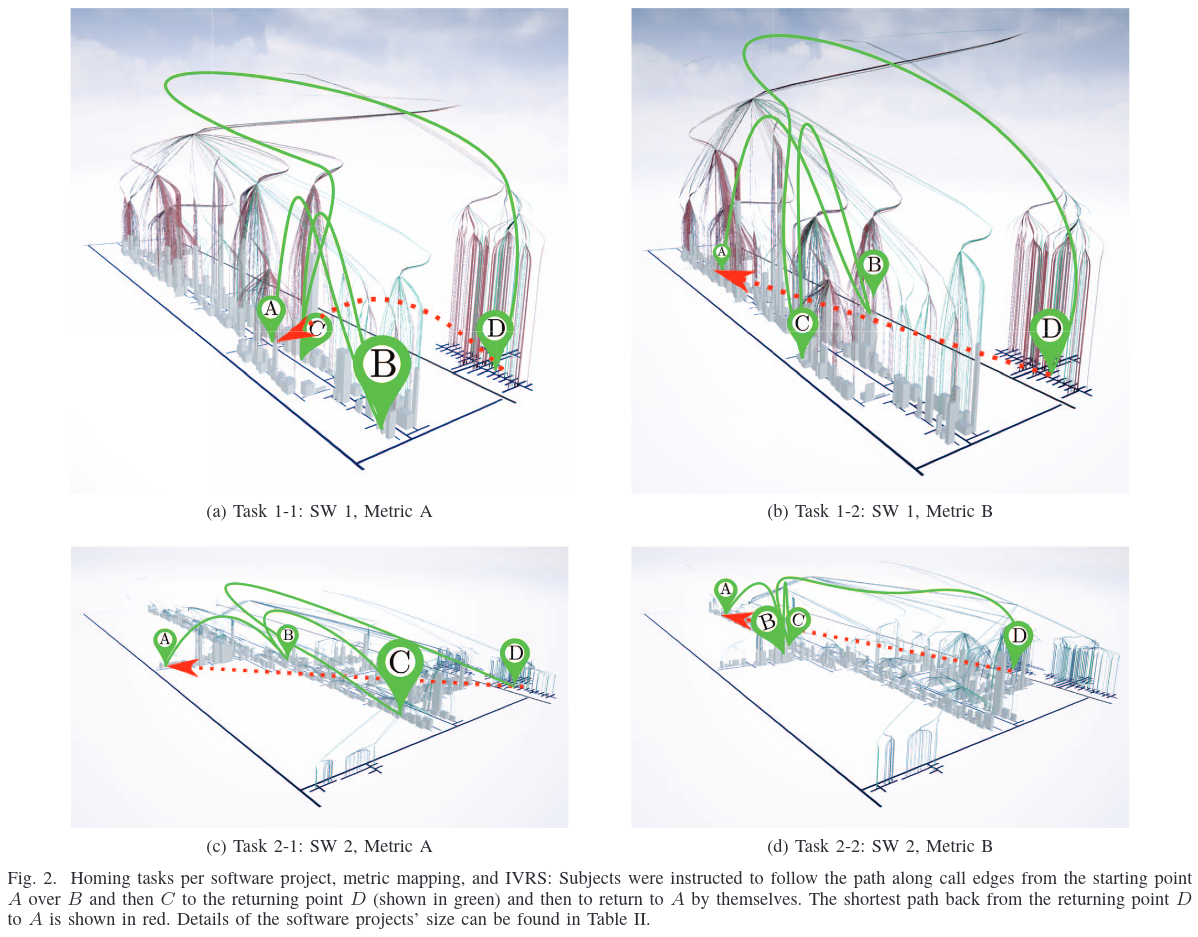
Brief Update on Dr. J's City Efforts
- So far this semester I have submitted two conference papers, one a
literature survey, one on the basic city layout.
- Third
paper, on the architecture, is under construction.
- If you were to go to grad school (and say, do an M.S. thesis),
you may well
follow a similar arc: get a vision, do a literature survey, design
and implement something new, and evaluate evaluate evaluate
- Some of you have demonstrated that you'd be able to contribute to
this research, even if we haven't managed to make it magically happen.
- Typical CS undergrad doesn't realize whether they are grad school
capable, let alone whether or not it would serve their interests.
- For the grad students in this class: thank you for your participation.
Whatever else you learned here, I hope you picked up on the notion that
communication and relationships are important in research, even if you
find that out via my flaws and limitations.
lecture 37
Grading Update
HW#4 grades varied widely. Feel free to improve and resubmit.
Timing Update
- current versions of Mingw64 GCC now have
clock_gettime() in their C libraries.
- You can read more about
clock_gettime() at Paul
Krzyzanowski's page. Basically, it provides
CPU timers at nanosecond resolution.
- Unicon has a tendency towards a lowest-common denominator and/or
"best Windows approximation of UNIX behavior" when it comes
to non-portable C API's.
- That might mean, for example, that we live with millisecond timing
in &time even though some OS'es can do microseconds or nano-seconds.
- In the case of
clock_gettime(), the Lowest Common
Denominator is that it
gives us user CPU time, but not system CPU time. On UNIX we add in
system CPU time via a call to (lower resolution) times() function, but
that is not present on Windows.
- Summary: Dr. J has built a Windows Unicon that uses clock_gettime()
with its finer resolution; not tested yet; will make binaries available.
What Dr. J is Thinking About
- I am thinking about how to evaluate monitoring and visualization
framework scalability.
- Toy suspects are great, but there are no object-oriented programs
in the mix.
- The Unicon benchmark quite is also basically not object-oriented
(a couple classes are used to implement a Thread Pool for the concurrent
tests).
- How about a validation test for OO behavior consisting of the three
biggest OO Unicon programs in the distribution?
unicon itself,
the ui IDE, and the ivib visual interface
builder.
- They need to do some defined operations on some defined test
input. Fine, how about if we add a button to a dialog, and define
its code body to exit when clicked.
- Two of them are user-interactive GUI's, so that will take some
engineering. Like, turn them into non-interactive by inserting a
mechanism for recording and replaying their logged GUI events.
- Then, run them on recorded GUI logs, and observe for our software
city virtual environment visualization/monitor:
- how many objects were created
- how many method calls/returns can the tool process per second
- how many frames per second does the visualization maintain,
with this number of objects spawned and moving around
- I fully expect to bring my visualization system to its knees, and spend
some quality time studying and improving its performance
- Are you expecting to bring your semester project to its kneeds, and
spend some quality time studying and improving its performance?
lecture 38
Yeah, so, how was EXPO?
JIVE (Java Interactive Visualization Environment, Gestwicki et al)
This paper is too old for me to assign as a required reading,
but it has some nice properties: it is about a mainstream language
(Java), and it lays out an ambitious set of goals for us to compare, and see
if we should be aspiring to also do them.
- multiple concurrent (visual) representations
- reverse execution
- graphical queries
Major requirements:
- depict objects as environments. method calls happen inside one.
This immediately challenges the objects-as-robots metaphor.
- multiple views. Different Granularities. detailed view and compact view.
- histories - of execution, of method interaction... show sequence or
collaboration diagrams (how do they address scalability? From Figure 1
the answer initially seems to be: they don't; from Figure 2 one answer
is, things shrink down to points). This is
not summary statistics, it is timelines and such
- forward and backward execution. state-saving model. big Big logs.
- queries on the runtime state. when did a variable change; or when did
it achieve a certain value
- clear and legible
- use the stock JVM
- be able to visualize programs that themselves have GUI's!!
Graphic design: simple, relatively easy to understand, scales poorly
(minimal "visualization" involved, maximum IDE/debugger-like feel)
Analysis: hardwired, except that it supports a range of queries. What is
the query language?
Implementation: Two-process model, supports multiple threads so long as
only one runs at a time. Log file coupled with "in-memory"
execution history database. Events are able to commit and un-commit
themselves.
7 event types: static context creation, object creation, method call,
method return, exception thrown/caught, change in source line, and
change in variable value.
Stepping backward does not modify the client program, it is suspended
until you get back to the current state and move forward. (Means: you
can't modify the past, but maybe you can modify the present).
Queries: on program history; may return values, sets of states,
or portions of program history. Visual representation of program
states and program history means queries and results may be done
graphically. Queries vis-a-vis variables in single instances or classwide.
No evaluation of scalability or effectiveness of using UML-like depictions.
JPDA: Java Platform Debugger Architecture
Originally there were the JVMDI and the JVMPI; now there is the JPDA.
JIVE has to live on whatever the JVM feeds it. JPDA includes the JDI
(Debug Interface), JDWP (Wire Protocol), and JVM TI (Tools Interface)
which replaced JVMDI/JVMPI.
Compare this access to the value of a variable in Java, with the
Unicon/Alamo access to a variable via variable(s, Monitored):
theStackFrame.getValue(theLocalVariable)
... transmitted via a socket / JDWP ...
jvmti->GetLocalInt(frame, slot, &intValue)
... result transmitted back...
- This is a two-process, separate address space model,
limited to the speed of whatever OS/network connection
the EM has to the TP.
- If you only have to execute as fast as a human user types
"print" commands, this is plenty fast enough.
- If you want to run it far faster than human, in order to drive
a big animated visualization with lots of moving parts, this
might not be fast enough.
- If I am doing a software city visualization that runs the target
program on a server, I might get the same network performance
bottleneck.
- From experience, modern networks have the bandwidth we need, but
clients and servers can only process so many packets per second.
- If you use JDWP, or if you do any other network-based two process
communication, you are likely to need to bundle many messages
per packet and send only a few packets per second.
This paper is ancient eye-candy I am including for sentimental reasons, but
it is another representative of the class of visualizations that are geared
towards understanding the changes in software over time, the same
perspective the authors of the visualizing-software-as-cities paper took.
It is not the here-and-now of a current execution, it is the view of code
across the ages.
Given a software repository (they talk about CVS, a fine predecessor to
Subversion; you might do the same for Git), how do we visualize a program's
change over time? For each revision, they collect/measure/compute:
- The author of each change of each file.
- The control flow graphs of each method in the program.
- The change in each basic block in the control-flow graphs.
- The inheritance graph of the program.
- The call-graphs of the methods of the program.
- The time of each change to each file.
lecture 39
No Office Hours today
Sorry, search committee meeting, if you need office consultation please
e-mail me and suggest your available time(s).
Mailbag
- I was wondering if you have any test suspects or programs I could
use to monitor for class and methods?
- Great question. unicon (~7K LOC), ui (~9K LOC), and ivib (~16K LOC)
are three example OO programs
that one might try to monitor, but maybe we need something smaller.
Within unicon/uni/progs a couple programs are possible:
deen.icn (200 LOC)
is a toy German-to-English dictionary, while umake.icn
(300 LOC) is a simplified variant of the "make" program.
Deen takes German words on its command line and writes out English. A
sample run might look like:
$ ./deen Ich bin ein Berliner
Opened file(de-en.txt).
Reading.....................................................................................................................................................................................................
done.  Read 197771 lines
Ich: self
bin is not in the dictionary.
ein: a
Berliner: doughnut
Deen is a toy program and is a far from ideal representative of
object-orientation, but it is small enough that it would be easy to use
as a suspect. At least it is OO enough to have some inheritance and some
aggregation going on. Monitoring the unicon compiler compiling itself,
or a ui session, or an ivib session,
would be a far more impressive and challenging OO demonstration.
- What were the Issues of 3D Software Visualization that they wanted to
overcome?
- what's difficult about navigation
- what's difficult about occlusion
- what's difficult about selection
- what's difficult about text readability
- Is the hypothesis ("displaying 3d software visualizations in immersive
augmented reality can help to overcome usability issues of 3D
visualizations and increase their effectiveness to support software
concerns") almost the same as that posed by Rudel?
- What was their test of this hypothesis, and what was the outcome?
- In their conclusions they assert that augmented reality provided the
"highest performance to find outliers", but in the results section they
state that a standard computer screen required the least time and gave the
highest correctness for this task. What gives?
- This paper is about filtering techniques, which makes it
potentially important.
- The paper's phrase "execution traces" could equally well be read
as "log files" or "event sequences".
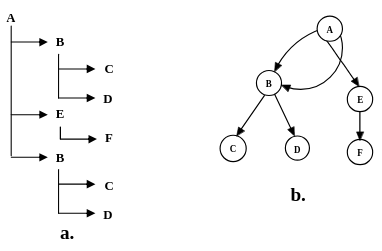
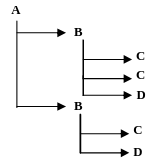
- Execution traces are very large, and very redundant.
- The ubiquity
and reliance of most algorithms on loops guarantees this will be true
for most programs.
- The analysis used in a software visualization should generally
abstract and filter the data before it starts drawing graphics.
-
Figure 2 of this paper gives a toy example in which a tiny duplication
is removed; in practice, scale it up many orders of magnitude.
- multiplicity
- In software engineering design diagrams, multiplicity is commonly
used to indicate the number of instances involved in a given association
relationship. Might we use regular expressions to describe multiplicity
in execution traces?
A->B*-*>C*D
- Removing "utilities"
- constructors/destructors, accessor methods, utility
and library classes. Potentially many incoming edges, with few or no
outgoing dependencies.
-
Polymorphic methods
- execution tree differences can be ignored when the
abstract function performed is understood.
lecture 40
Mailbag
- When I tried monitoring OO examples, on Windows I was unable to get them
to run. On Linux they work fine...but my Linux Unicon does not do 3D.
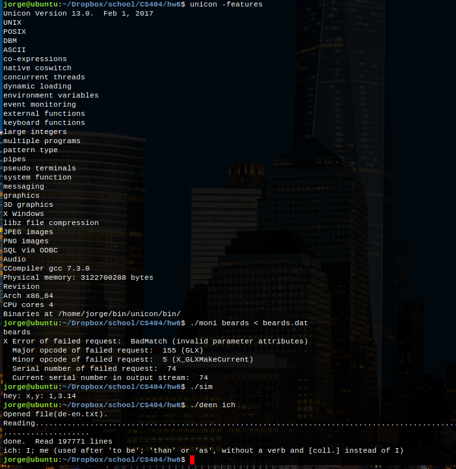
- Thank you for the screen shot. I recommend an office consultation to
look at your 3D issues. I may be able to get things to run on Windows.
Zoom is a good way to do an appointment, if you can't bring the hardware to
my office.
- In the fifth example of the HW4's you showed in class one of the
students drew text in a 3d environment quite well, That didn't appear to be
a texture, but instead a sole graphic. If you have time could you tell me
how this student went about displaying this text? I would like to use it
for my final project.
- Sure, let's go look at those.
Dr. J Status Report
- I have been tied up a lot of the past two weeks writing the
final version of a
conference paper
based on the literature survey I did for this course.
- The good part about writing a final version is, I found many more
software city visualizations than I knew about in my first pass in January.
-
Another good part is that I got acquainted by e-mail with a lot of the
people who have done important work in this area.
- The downside is that I haven't had free time to work on the next steps
in my implementation.
- Remainder of today's class, and Friday's, looks at some of these papers.
Questions Regarding Final Exam Project Demos
- How are you going to spend your 10 minutes?
- Tell a story.
- Show pictures.
- Evaluate scalability: does it run on larger examples, or only toys?
- Analyze the events before you start kicking out graphic primitives
- If possible, ascertain how much time is spent on the monitoring/analysis
versus how much time the graphic rendering costs. Balance would be good.
This paper appeared in the 2018 Working Conference on Software
Visualization.
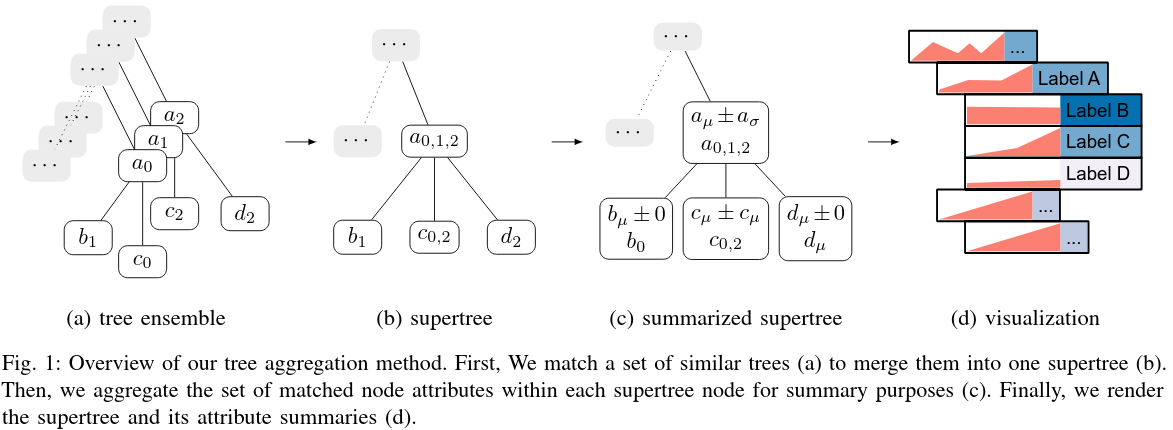
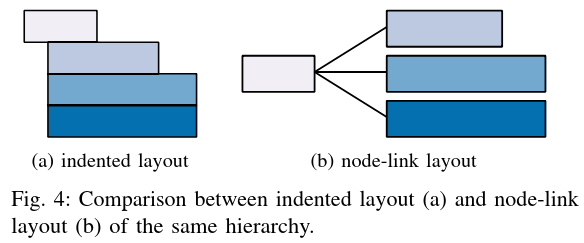
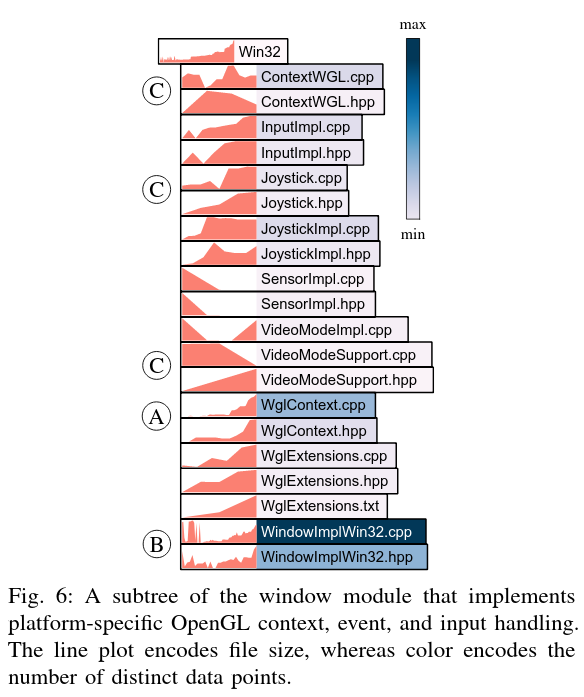
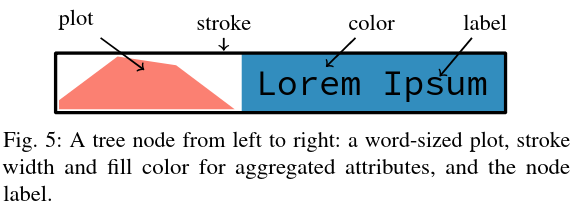
More Research Papers?
Some papers that I didn't have on our reading list. Discovered while
preparing final copy of a literature survey on software cities.
- Interactive Views to Improve the Comprehension of UML Models - An Experimental Validation,
by Lange and Chaudron. 15th International Conference on Program Comprehension,
ICPC'07.
- 2D and 3D Visualization of AspectJ Programs, by Bentrad and Meslati. In Proceedings of the 10th International Symposium on Programming and Systems (ISPS), pp. 183-190, IEEE Computer Society Press, 2011.
-
An empirical study
assessing the effect of SeeIT 3D on comprehension
by B. Sharif, G. Jetty, J. Aponte, and E. Parra, in Proc. of
VISSOFT. IEEE, 2013, pp. 1-10.
lecture 41
Mailbag
- I was the author of the code that had the string implementation that
was requested. You have my permission to share the code. How I implemented
that was from one of your examples shared in class where you started by
opening a 2D window.
- Thanks for your permission. Code presented below is from your HW#4;
I have not checked if you changed anything from what I gave earlier.
- I am currently done making my buildings in my semester project but I
wanted to add some detail to the city I'm trying to build. How would you
recommend me to approach making a road or a ground surface so my building do
not look like they are floating?
- For my city, I took a single big 2D image and used it as a texture for
a single rectangular ground surface. Since my area was large, this
stretches out the pixels enormously. It would be possible to either (a) use
an image that repeats many times in both the x and z dimensions so that it
doesn't look pixelated, by using texture coordinates > 1.0, or (b) plot a
non-flat ground surface, if you preferred, perhaps using a 2D matrix whose
values are the "y" values at the various x,z locations around your ground
surface.
Fonts from the Fifth HW#4 Example
Well, there is this bit. It depends on a textures already set, and a
twidths table already initialized.
# Code from Dr. Jeffery's text.icn example #
procedure myDrawString(x,y,z,s)
    WAttrib("texmode=on")
    every c := !s do {
        i := ord(c)
        row := i/16
        col := i%16
        ht := 20.5
        wd := 20.5 * real(twidths[c]) / 32
        u1 := col*32.0/512
        v1 := 1.0-(row+1)*32.0/512
        u2 := col*32.0/512
        v2 := 1.0-row*32.0/512
        u3 := (col+(wd/ht))*32.0/512
        v3 := 1.0-row*32.0/512
        u4 := (col+wd/ht)*32.0/512
        v4 := 1.0-(row+1)*32.0/512

        Texcoord(u1,v1, u2,v2, u3,v3, u4,v4)
        DrawPolygon(x-wd/2,y-ht/2,z, x-wd/2,y+ht/2,z,
		    x+wd/2,y+ht/2,z, x+wd/2,y-ht/2,z)
        x +:= wd + 0.1
    }
end
The initialization code was found in main()
   &window := open("win","g","size=512,512",
		    "font=sans,32,bold", "canvas=hidden") # 2D window is hidden
   #### Code from Dr. Jeffery's text.icn example to draw strings #####
   asc := WAttrib("ascent")
   every i := 1 to 16 do
      every j := 1 to 16 do {
         DrawString((j-1)*32, (i-1)*32+asc, char((i-1)*16+(j-1)))
         }
   twidths := table()
   every i := 0 to 255 do twidths[char(i)] := TextWidth(char(i))
   wfont := &window
   &window:= open("HW4", "gl", "size="||size)
   WAttrib("texmode=on")
   Texture(&window, wfont)
Brief Discussion of Texture Tiling
Mostly review, I would guess
- Textures are 2D images whose sizes are powers of two.
E.g. you might have a 512x1024 pixel image
- Textures are always rectangles, even though in 3D, you always
render triangles
- texture coordinates are Cartesian and "normalized"
- (0.0, 0.0) is the lower left of the texture, (1.0, 1.0) is upper right
- (x,y,z) vertices in 3D space map to (u,v) points in normalized
texture space
- usually this is, for any triangle in 3-space, extracting a triangle
slice of the 2d image
- common to pack many triangular textures into one big texture image
- also common to repeat a texture many times to fill a large triangle
- texture coordinates > 1.0 say to repeat texture
- by default this will have seams at edges
- some textures are inherently seamy; on others seams are ugly/unnatural
- techniques exist to modify a texture so it is seamless, good for
e.g. grass, clouds, etc.
Mini-example.
In CVE, we have carpeting and flooring and walls.
 If we tried to use textures that cover the entire area,
we would either be far too low-resolution, or use far too
much texture memory.
We need high resolution textures that can repeat
For an arbitrary space to be textured, how many times should I repeat the
texture?
Measure/estimate/record real-world size of NxM pixel image.
In CVE, in the textures directory we placed a mini-database of
the textures' real-world sizes. I suppose I should convert to JSON:
If we tried to use textures that cover the entire area,
we would either be far too low-resolution, or use far too
much texture memory.
We need high resolution textures that can repeat
For an arbitrary space to be textured, how many times should I repeat the
texture?
Measure/estimate/record real-world size of NxM pixel image.
In CVE, in the textures directory we placed a mini-database of
the textures' real-world sizes. I suppose I should convert to JSON:
floor_1.jpg
{
   name floor1
   real_world_x .4
   real_world_y .4
}
Divide real-world size
of space to be textured (i.e. x,y,z world coordinates of vertices)
by real world size of image.
Result is (u,v) texture coordinates saying how many times to tile
For the JEB tile, we estimated it as 0.4x0.4
(a little less than half a meter). You would tile it 2.5 times in
each dimension to fill 1 square meter.
For the JEB 2nd floor corridor outside my office, we measured
21.1x3.4 meters. The (u,v) is (52.75,8.5). The four texture coordinates
might be (0.0, 0.0), (0.0, 8.5), (52.75,8.5), (52.75,0.0).
Vertex
order matters. It will look crazy if (x,y,z) vertices are not given in
same order as (u,v) texture coordinates. Easy to get things flipped,
skewed, etc.
In my city, I tossed in some building textures real fast, but didn't
supply texture coordinates? So my buildings did not know how to tile
last time I showed them to you. Maybe by next Friday, they will. :-)
by Greevy, Lanza, Wysseier (SOFTVIS 2006)
From the same group that gave us CodeCity (and preceding that paper!), this
paper gives me great hope of addressing some of the issues that I am
passionate about, regarding the visualization of static+dynamic information.
- "feature-centric reverse engineering"
- you know, captured traces of selected runtime behavior. Like as if you
used an Event Mask to only ask for features of interest.
- how static source artifacts contribute to runtime behavior
- the connection of statics to dynamics is a central task
- "feature trace"
- a record of the steps a program takes during execution of a feature
- "feature"
- user-triggerable functionality of a software system
- which parts of the code are active during the execution of a feature?
- what's instantiated and how objects collaborate on a feature
- what patterns of activity are common across features?
- alleged to give insights into the architectural structure of the system
- what activities are specific to one feature?
The Greevy approach:
- apply static analysis, extract a static model
- instrument the code
- execute code to obtain traces ("trees of method calls") of feature executions.
- resolve/bind/connect trace events back to static model
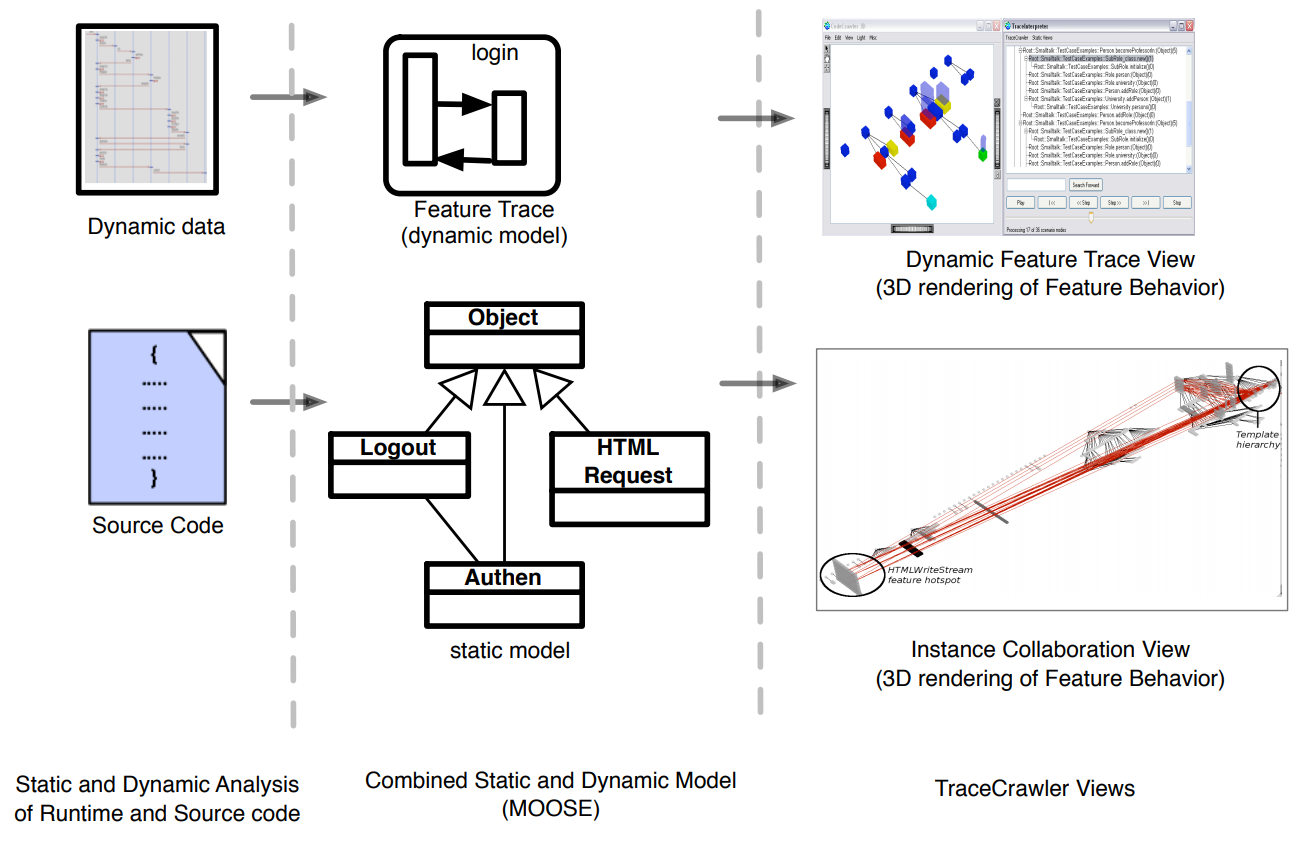
Trace summarization may eliminate details that provide valuable insights!
Visualization is Static class hierarchy + "towers of communicating instances".
(Sounds Very similar to SynchroVis, which came after).
5 Dimensions of Interest of Software Visualization (Maletic):
- Task. Why is the visualization needed?
- Audience. Who will use the visualization?
- Target: What low level aspects are visualized?
- Representation: What best conveys the target information to users?
- Medium: where are the visualizations rendered?
by Davis, Pestka, and Kaplan (VISSOFT 2003)
KScope
- compare "reverse engineering" of standard UML (left) with
Kscope visualization (right)
- there is a class under study (multicolored cube)
- cube vs. pyramid for class vs. interface
- dark blue == "terminator class" (library class)
- line color (red=association, blue=dependency, magenta=composition,
black=implementation, green=inheritance, yellow=interface inheritance)
- click things for info detail
- BCEL:
Byte Code Engineering Library, a Java thing from Apache.
Perhaps subsumed by ASM
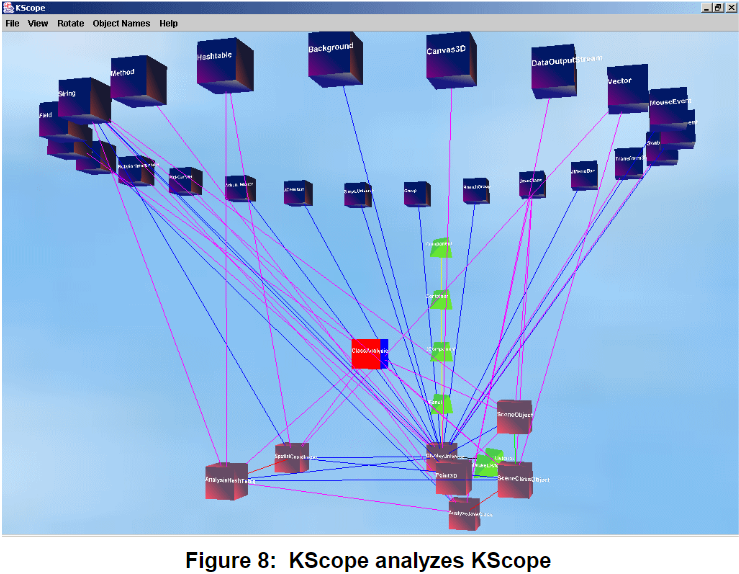
by Zimmermann and Zeller (Dagstuhl seminar, 2001)
Who needs visualization? Programmers debugging bugs need visualization!
(gdb) print *tree
*tree = {value = 7,name = 0x8049e88 "Ada", _left = 0x804d7d8,
  _right = 0x0, left_thread = false, right_thread = false,
  date ={day_of_week = Thu, day = 1, month = 1, year = 1970,
  _vptr. = 0x8049f78}, static shared = 4711}
Modern GUI debuggers still mostly show these values as text.
If you use a good one, you might get some depiction of pointers:
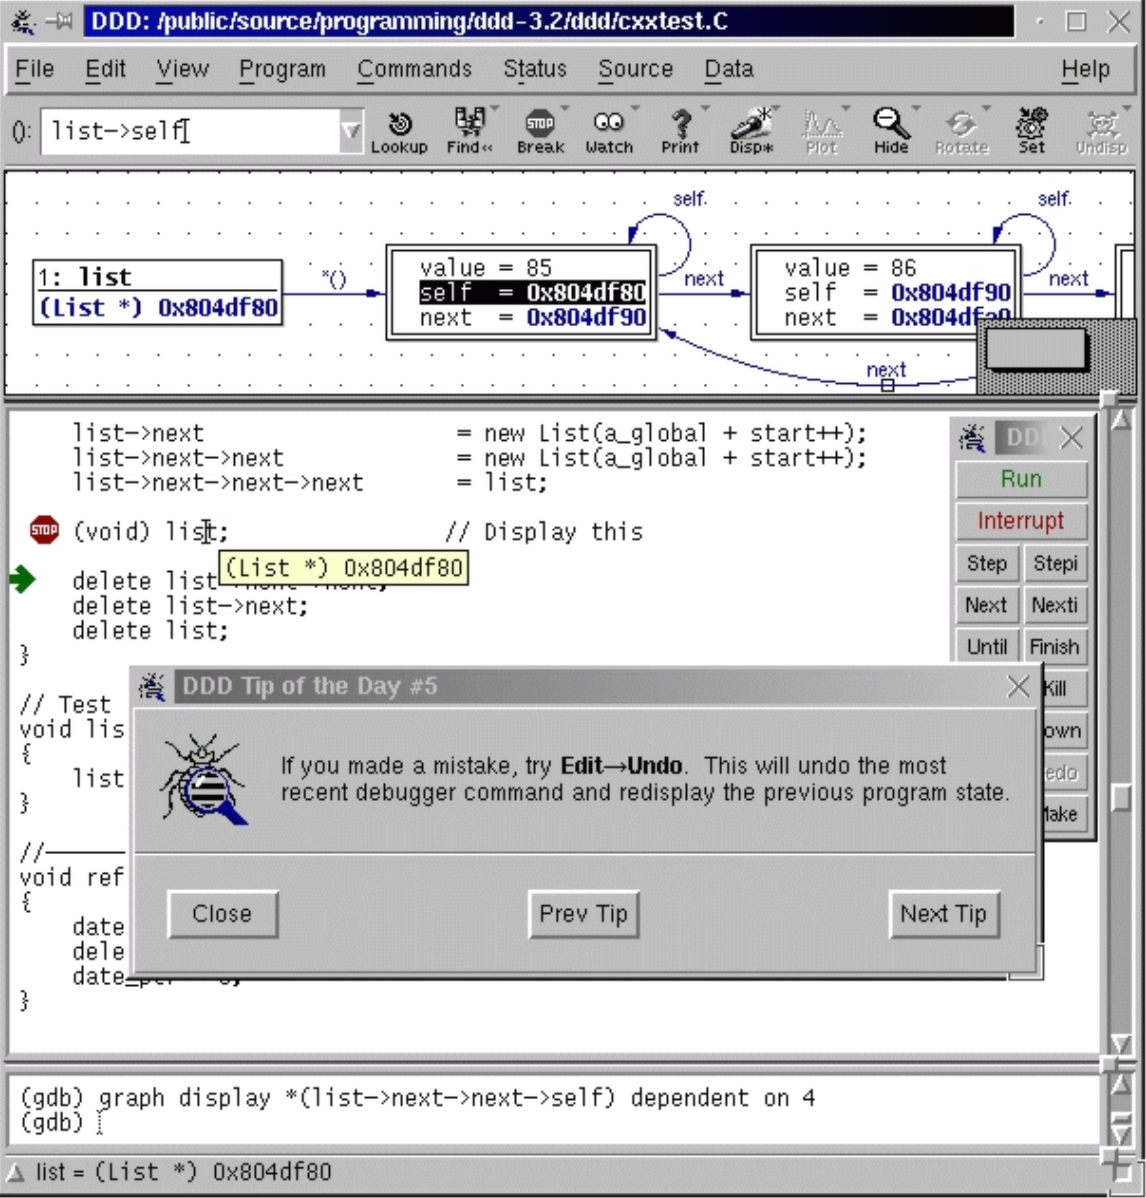
DDD (pictured above) makes you expand/follow each pointer manually.
- Pro: program is in control, sets focus of what is to be displayed.
- Con: wow, to display a linked list of length 100, click 100 next pointers.
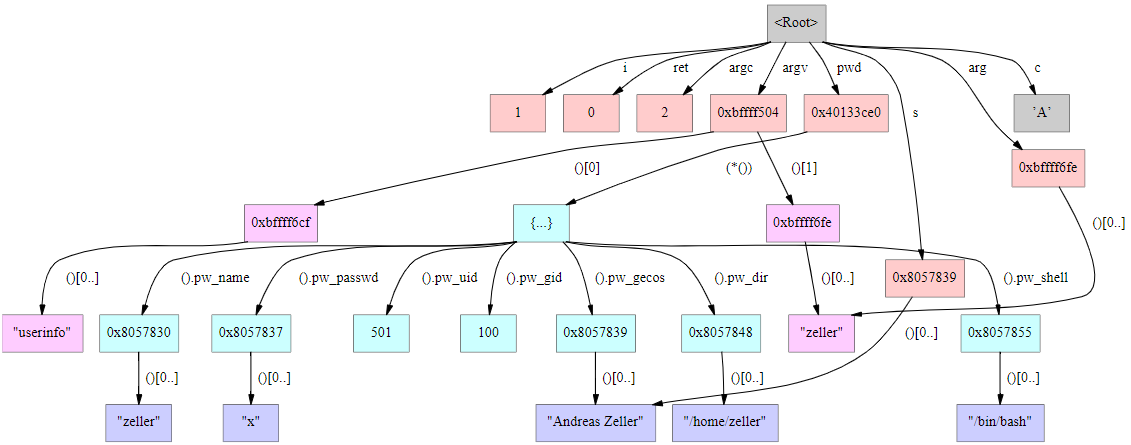
A memory graph (pictured above) might in fact be a graphic depiction of an
entire program state. Consider it to be a (relatively) brute force or
literal depiction of memory, with pointers as arrowed edges. Given this
depiction, how easy is it to answer questions like these:
- are there any pointers pointing to this address?
- how many elements does this data structure have?
- is this allocated block reachable from within my module?
- did this tree change during the last function call?
Now: what downsides or challenges can you suggest might occur with memory
graphs?
How do they get these memory graphs? I think it is fair to say: painfully.