More recently, several research groups have visualized the evolution of large software systems using progressively more sophisticated "city" metaphors, mapping information about software components onto familiar architectural features such as buildings and roads. Up to now, this metaphor has been applied to static or slow-changing information, such as examining months or years of changes in a software repository.
This paper presents a survey of existing work on visualizing software as cities, and then introduces a "living city" metaphor, in which a set of programs written by a set of authors is visualized as a city populated by dynamic entities such as users, data structures, threads of execution, and bugs. An implementation of the "living city" is proposed. The paper includes a discussion of what will be needed, both in terms of open research problems and existing and needed software tools.
In the 1980's, the promise of software visualization was made apparent by films such as Sorting out Sorting[1], and subsequent software systems such as Balsa [2]. It was clear then that appropriate graphical depiction of software would enhance understanding and be useful for tasks including construction and debugging. However, software visualization is still an exotic task. We still face programs primarily as a task of scrutinizing static source code, or wading through volumes of debug, profile, or log data. But intuitively our vocabulary when discussing code continuously refers to intuitive visual metaphors.
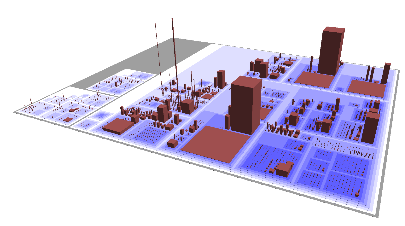
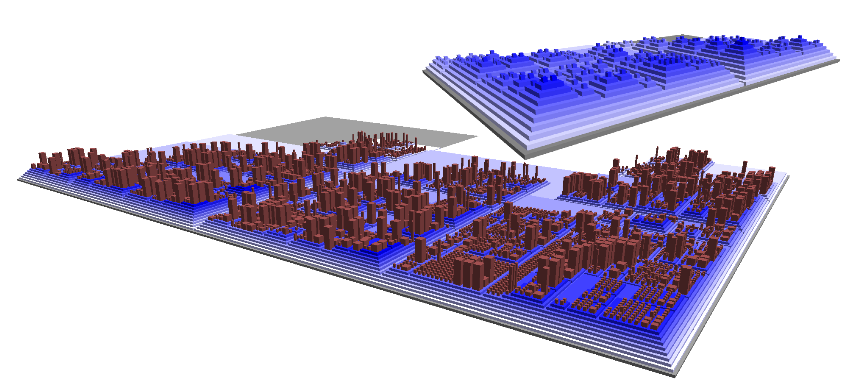
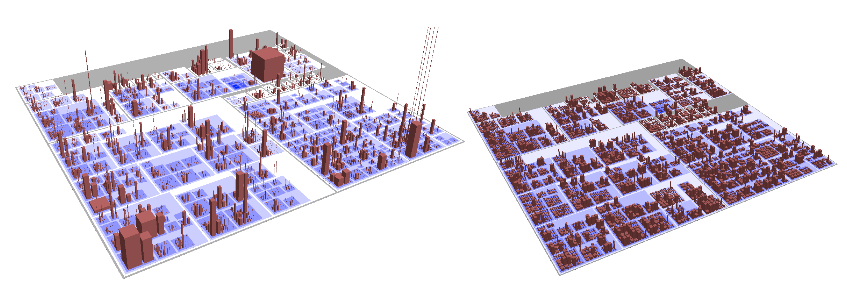
With this simple metaphor, Wettel and Lanza depicted very large software systems, such as an 8,000 class SmallTalk program. The left image shows class dimensions mapped 1:1 onto building dimensions; the right image shows class dimensions scaled to reduce the effect of outliers. In CodeCity, the altitude or base land topography depicts package structure. Some software systems written in some languages such as Java emphasize the use of packages for code organization; in many languages that do not, directory organization might play a similar role in large programs.
Wettel and Lanza's overall city layout, other than to group classes in the same package together, is fairly arbitrary. A modified treemap algorithm [4] is used to place buildings largest-first, splitting rectangles into smaller pieces into which smaller rectangles can be placed. their modified treemap algorithm might be improved upon by a static layout that uses software coupling to position related classes near each other.
Wettel and Lanza used their software city metaphor to study how software systems evolves over weeks, months, or years in a software revision control repository. This use focuses on relatively static information, and any change would only be perceived by the equivalent of slow-motion photography. Their metaphor provides the static backdrop for the visualization of dynamic program behavior in this research.

Knight and Munro [8] developed a prototype called Software World for visualizing Java code in which a program is treated as a virtual world, a directory or package is a country, each single file is a city, each class is a district, and each method corresponds to a building. Like Wettel and Lanza, they do not go so far as to propose how to map individual statements and expressions in the code into an interior of their building, but they do assign building exterior characteristics based on size, number of parameters, and so on. In general, the finer granularity of this mapping of code onto virtual-world entities has its pros and cons. Having a 3D volume (building interior) might allow a better mapping for large methods, than a metaphor where an entire class is a building and each method occupies one storey, implying an essentially 2D layout for control structures.
In addition, Wettel and Lanza's work inspired several other researchers to go beyond the study of software repository evolution. Kuhn, Loretan, and Nierstrasz [5] developed a more topological form of software maps, with some interesting mathematics applied to develop what look like island chains depicting relationships and attributes of software components. Honestly, I think these maps are very pretty, and the math in the paper for constructing them from real relationships between components is interesting and deep. These maps do not inspire the scrutiny of multi-dimensional detail that CodeCity does. However, they and the mathematics underneath them might be useful in positioning related programs that are not explicitly connected.

Steinbruckner and Lewerentz [6] pursued the city metaphor further in a tool called CrocoCosmos in which they developed a much more sophisticated and information-based layout. They adopt practices from cartography in terms of establishing a primary model (a data structure abstracting the software system in its own terms) and then using secondary and tertiary models to graphically depict detailed information. Subsystems/packages are depicted as streets, with contained classes as buildings on those streets. Age is seemingly depicted by both centrality (older modules are near the center, as with real cities) and elevation.
Caserta, Zendra, and Bodenez [7] develop hierarchical attraction points in order to superimpose a depiction of relationships between classes as lines drawn above buildings in a city metaphor. While many or most (especially object-oriented) programs are understood largely through the static relationships between their classes and runtime relationships between instances, I don't think a big wad of red and green yarn is going to contribute greatly to clarity. It might, if it was transparent enough, provide subtle additional hints, or a Futurama-style teleportation tube system.

For example, the CodeCity authors noted that many classes were impossibly tall (over 1000 methods) relative to their length and width (only a few attributes). As a building, it looks inhuman. If a human is looking for problems in the code, they will be tempted to look for "wrong-looking" structures, but there is potentially nothing wrong with these classes just because they look impossibly tall and skinny. Worse, the CodeCity authors elected to adopt a non-linear scale of the buildings' height in order to make such classes look more like plausible buildings that might appear in a human city. Actually, visualization is full of adjustments to scaling. In an exponential computing world, a logarithmic scale is a visualization designer's friend. However, the reason to adopt a non-linear scale had better not be to make the data fit the metaphor.
The vision advocated in this paper is to use the software city metaphor to implement a collaborative virtual environment for software development. In order to achieve this vision, many extensions to the relatively static software city metaphor are needed, but the primary extensions will be the introduction of dynamic entities with which to interact, and things to do in the city.
The main issues are: willingness to share, and offering something to gain by participation. The main technical gains from collaboration include peer assistance and review, but the main reasons to do all this in a collaborative software visualization environment is to inject interest and fun, and reduce the cost of collaboration.
Most prior work focuses on visualizing single (albeit large) systems written in a single programming language. In the general case, an ecosystem entails visualizing a rich heterogeneous set of entities written in multiple (programming) languages.

If everything that has an execution call stack is represented as a
statue that moves as soon as you stop looking at it, this does not
explain the connection of such entities to related heap structures
or global variable regions. It does not explain how the stack
should be depicted/accessible by inspecting the statue.
Unicon City is a city built for the Unicon users. The case study considers
only the source code that happens to be bundled
with the main language distribution. Just for fun, the ecosystem of
Unicon source code studied explicitly does consider the
195,000 lines of C code in the language implementation with which that code
is distributed, although frankly, most users will not want to wander around
that side of town at night. It doesn't consider the millions of lines
of proprietary
Icon and Unicon code written and used in various organizations that haven't
gone to some effort to place their work in the public eye.
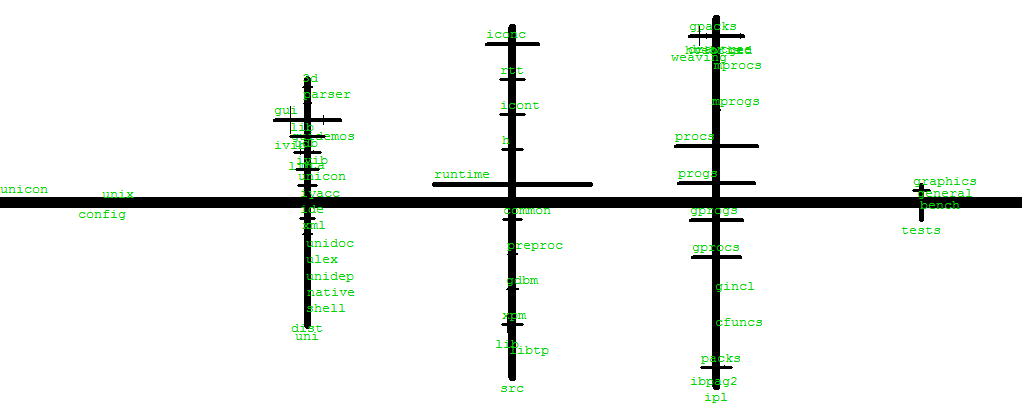
The .icn files in the Unicon distribution comprise some 350,000 lines of code
written by 60+ authors. A first goal for a living city would be to select
some space-filling algorithm for a primary 2D layout tool. To lay out Unicon
city, a primary horizontal axis street named unicon/ might be sized reasonably
such that a person could walk across it. Most MMORPGs', even if "World" is in
their name, cover the entire world in a few kilometers at most. There are
reasonable arguments as to
what arbitrary scaling measures one should adopt for software cities.
For example, we have a grand total of 570K LOC to lay out. Should the
length and width of the primary axis street be proportional to the number
of lines of code or to some other measure? A street 1cm/LOC long would be
5.7km. Pretty small, but large enough that one might want to take public
transport. As for the width of this primary arterial, ln(LOC) meters (13.2m)
might be about right. Using ln(LOC) for all streets makes all streets
fat and looking about the same.
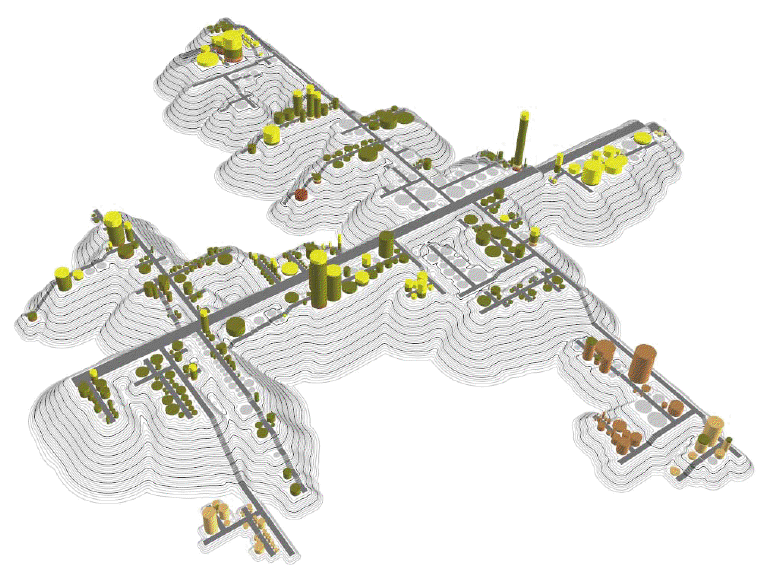
Self-critique is in order here. This first attempt at a street layout for
Unicon City has some pros and cons. A pro is that it was written with a
Unicon program (128 lines) and is easily modified. But it is a tree because
the Unicon
directory hierarchy is a tree, but real cities are not trees and do not
have a single central point that all cross-town traffic would have to go
through. The "CodeCity" treemap algorithm implies more crossing
roads due to its tendency to lay out disconnected parts of the tree adjacently.
The "CrocoCosmos" street-based layout is closer to what you see here,
albeit still quite tree-ish and underconnected.
A hand-drawn city layout would very probably be better than an
algorithmically-generated one. One research goal would be to
come up with a more natural, more city-like automatic layout
algorithm.
[2] Marc Brown and Richard Sedgewick, "A System for Algorithm Animation",
Computer Graphics 18(3), 177-186.
[3] Richard Wettel and Michele Lanza, "Visualizing Software Systems as
Cities", In Proceedings of VISSOFT 2007 (4th IEEE International Workshop on
Visualizing Software For Understanding and Analysis), pp. 92 - 99, IEEE
Computer Society Press, 2007.
[4] Shneiderman, B. "Tree visualization with treemaps: a 2-d space-filling
approach", ACM Transactions on Graphics, vol. 11, 1 (Jan. 1992) 92-99.
[5] Adrian Kuhn, Peter Loretan, Oscar Nierstrasz.
"Consistent Layout for Thematic Software Maps",
Proceedings of the 15th Working Conference on
Reverse Engineering, WCRE '08. Oct. 2008. pp. 209 - 218.
[6] Frank Steinbruckner and Claus Lewerentz.
"Representing Development History in Software Cities",
in Proceedings of the 5th international symposium on Software visualization,
SOFTVIZ 2010, ACM, New York, pp. 193-202.
http://csbob.swan.ac.uk/visWeek10/softvis/docs/p193.pdf
[7] Pierre Caserta, Olivier Zendra and Damien Bodenes,
"3D Hierarchical Edge Bundles to Visualize Relations in a
Software City Metaphor" in 6th IEEE International Workshop on
Visualizing Software for Understanding and Analysis (VISSOFT 2011).
[8] Claire Knight and Malcolm Munro,
"Comprehension with[in] Virtual Environment Visualizations",
in Proceedings of the Seventh International Workshop on Program
Comprehension, IWPC '99, Pittsburgh, PA, 5-7 May 1999, pp. 4-11.
[9] Craig Anslow, Stuart Marshall, and James Noble,
"X3D-Earth in the Software Visualization Pipeline",
X3D Earth Requirements '06 Workshop,
November 14-15, 2006,
Naval Postgraduate School,Monterey, California, USA.
[10] Thomas Panas, R. Berrigan John Grundy,
"A 3D metaphor for software production visualization",
Proceedings. Seventh International Conference on
Information Visualization, IV 2003.


Source: http://www.myspace.com/rockthe3d/blog/536537130


In discussion, there seemed to be support for the beam-of-light
model, pointing backwards from callee to caller.
The beam of light might be a good metaphor for an instant-teleportation
feature...


2.3 Dynamic Extensions
A living city has inhabitants, who do things, and interact.
The world itself is changed by actors and actions in the world.
Second Life or Minecraft might be a good mental model for this,
where software developers are construction and maintenance workers.
3. Case Study: Unicon
This section will present a design for a living city in which to
develop code for the Unicon programming language. This city will be called
Unicon City, in the hopes that the name harkens back to Raccoon City and
the Umbrella Corporation, but if that means nothing to you, you can still
follow the discussion.

4. Implementation
What tools have to exist in order to implement a living city?
5. Conclusions and Future Work
Vivacity, the Living City, is an ambitious to gamify human understanding of
computer program behavior by placing humans within the machine. It would
not be possible without a high performance program execution monitoring
engine, and an easy to use general purpose 3D programming
facility. By happy coincidence, this summarizes my professional training
and life's work.
Acknowledgement
Jafar Al-Gharaibeh provided thoughtful suggestions regarding
an earlier draft of this work.
References
[1] Ronald Baecker, "Sorting out Sorting", 1981, video, 30 minutes.